 |
MERCER COUNTY FARM BUREAU - WEATHER FORECAST DISCUSSION FOR MERCER COUNTY,ILLINOIS PRESENTED BY METEOROLOGIST PAUL OTTO, FREESE-NOTIS WEATHER |
 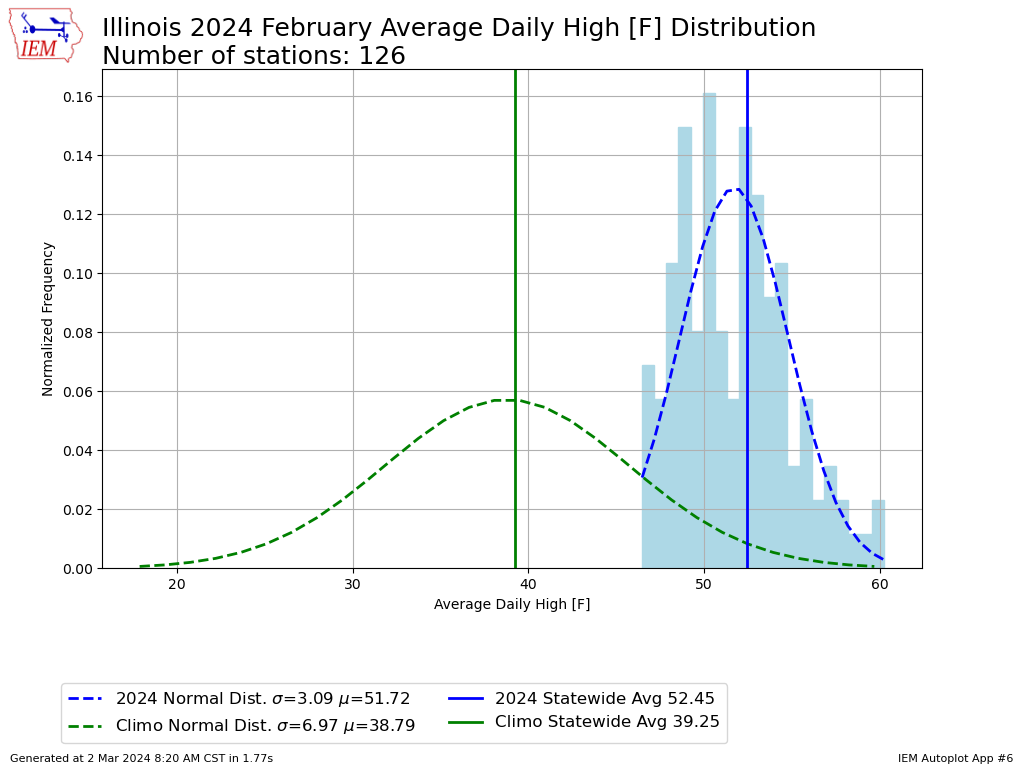 |
Extreme weather events seem to be the norm in 2024 so far. Dry windy weather in February has not alleviated the drought concerns in Iowa and western Illinois. Moline, Illinois received just 0.26" of rain during February, 2024. The average Daytime Maximum temperature averaged 13 Degress above normal almost unprecedented in more than 150 years of weather records. A closer look shows the average Daytime Maximum in February, 2017 was 13 Degrees above normal. Just for reference sake here are the Daily Maximum average monthly temperatures for Aledo, Illinois in 2017.
2017
Month Max Avg Dept
March 50 48 +2
April 65 62 +3
May 71 73 -2
June 84 82 +2
July 86 86 +0
August 80 84 -4
October 80 77 +3
November 49 45 +0
December 37 49 -2
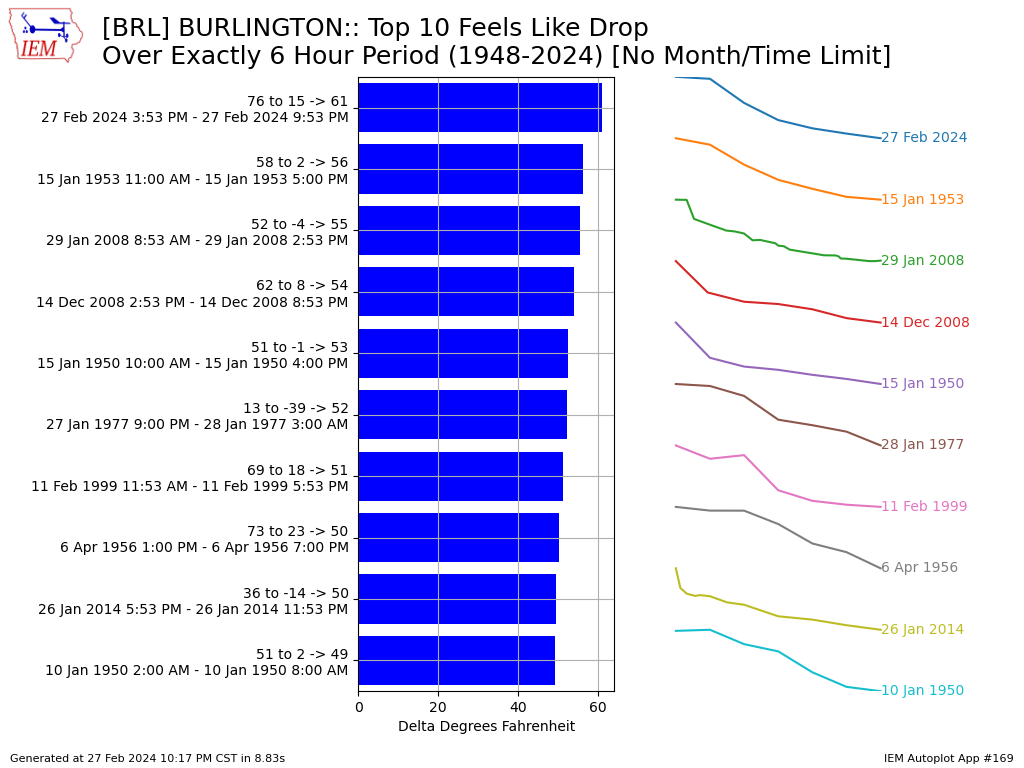 |
Just recently we felt the "Feel Like Temperature" drop sharply over a 6 hour time interval by 61 degrees in Burlington, Iowa from 76 F to 15 F overnight. This is the most extreme "Feel Like Temperature" drop for Burlinton, Iowa in recent memory. | |
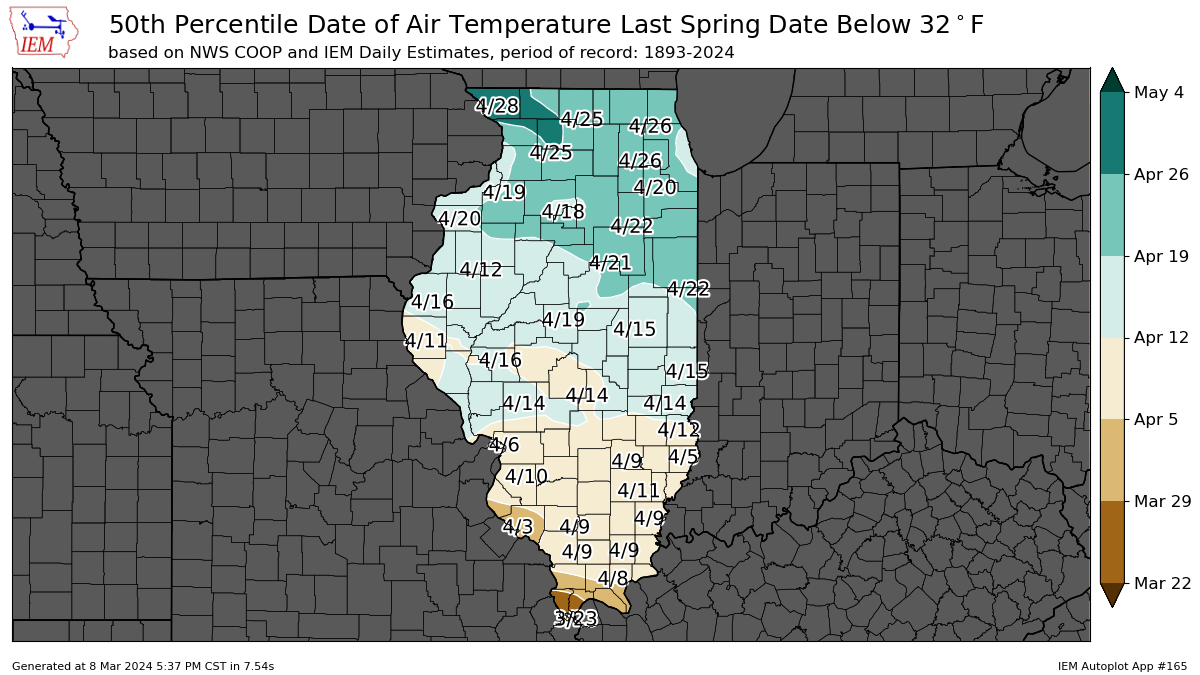 |
According to the IEM Mesonet data sets the average last 32 F temperature occurs on or about April 19th near Mercer County, Illinois.
The Last Freeze date in the spring at Moline Quad City Airport
2013 4 20
2014 6 7
2015 4 24
2016 4 13
2017 4 1
2018 4 29
2019 4 15
2020 5 12
2021 4 22
2022 4 19
2023 4 26
2024 4 20*
* 50% Probability of the Last Freeze date at Moline, Ilinois.
|
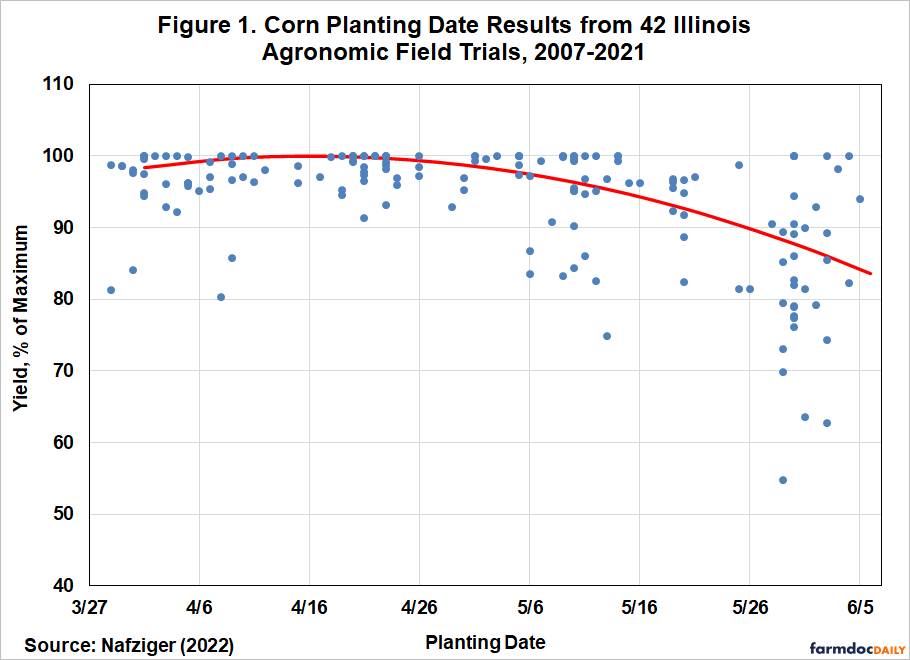 |
The impact of planting date on projections of Corn and Soybeans is always an important issue at this time of the year. A Professor Emeritus Emerson Nafziger has conducted planting date field trials for corn and soybeans for many years in Illinois. He shares his results in these corn and soybean yield versus planting date charts. The chart of corn planting dates show the optimal time to plant corn is relatively wide. Yield losses a couple of weeks on either side of an optimal window are relatively modest. Accordiing to the chart, planting corn as late as May 10th results in a yield penalty of only 4 percent. However yield penalties increase quikly once the calendar passes May 10th.
According to Professor Nafziger most people avoid taking insurance coverage risks by planting before the earliest allowable planting dates under the federal crop insurance program. The date of corn in central Illinois is April 5th, and for soybeans in central Illinois is April 20th. |
 |
The optimal planting window for Illinois soybeans is similar. Professor Nafziger results upend the old rule of thumb for decades that farmers should plant corn first and soybeans second. This actually compresses the combined window for corn and soybeans. |
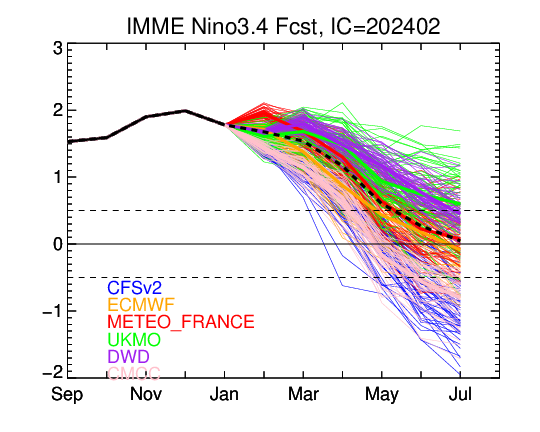 |
These maps represent El Nino 3.4 Sea Surface Temperature and the temperature trend into the Fall. Seasonal Forecasts use this sea surface temperature data as a input. On your left is the CFSv2 model and to the right the Australian Ensemble Model. You can see that the CFSv2 forecast is cooling sharply toward Neutral conditions by early summer and possibly La Nina by this Fall. Meanwhile the Australian Model provides a much different scenario as the cooling is less pronounced reaching neutral conditions by August. These differences in sea surface temperature forecasts can result in some rather large differences in Seasonal Temperature and Precipitation Outlooks.
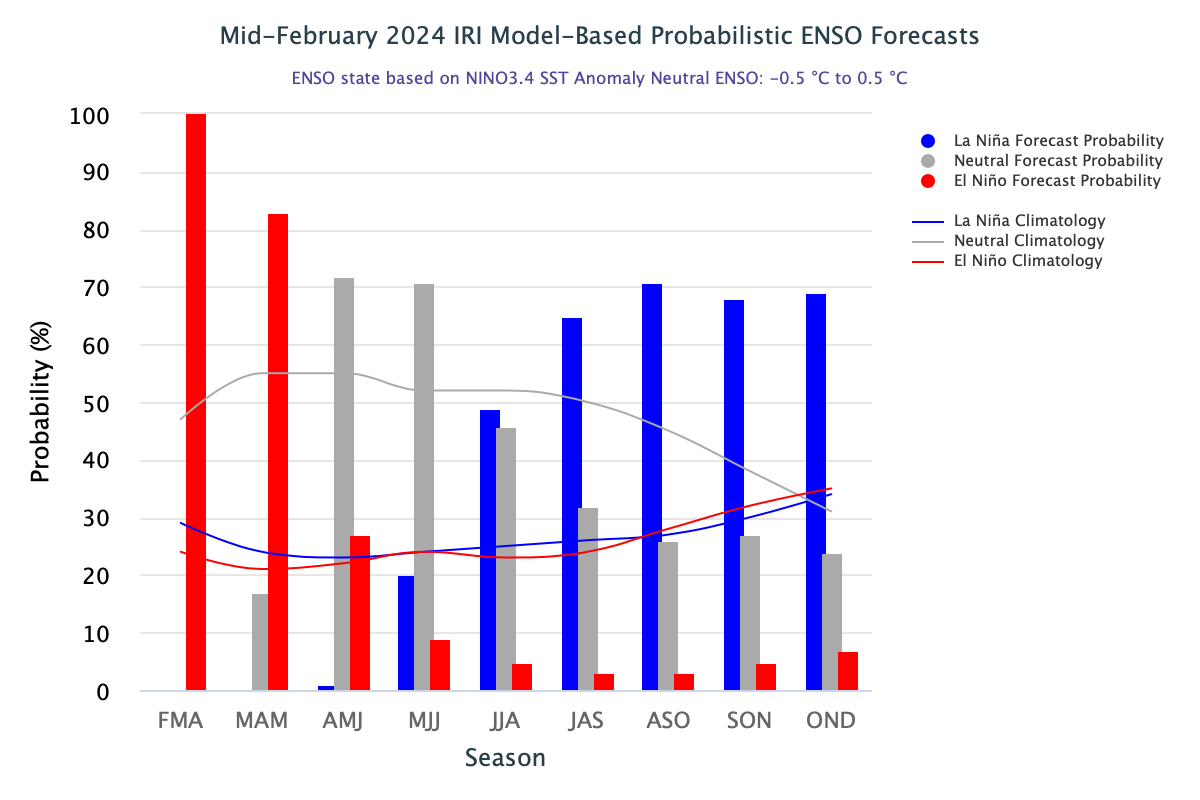
According to the CPC Weather Center, an El Nino advisory continues for the spring of 2024, alongside a La Nina watch issued for June to August 2024.
A transition from El Nino to ENSO Neutral is likely by April-June 2024 with 79% chance of this occuring.
The odds of La Nina event occuring between June-August are increasing to 55%.
* Some caution is advised using these latest ENSO statistics as meteorologists have noted the early spring predictions of El Nino have proven difficult to assess.
|
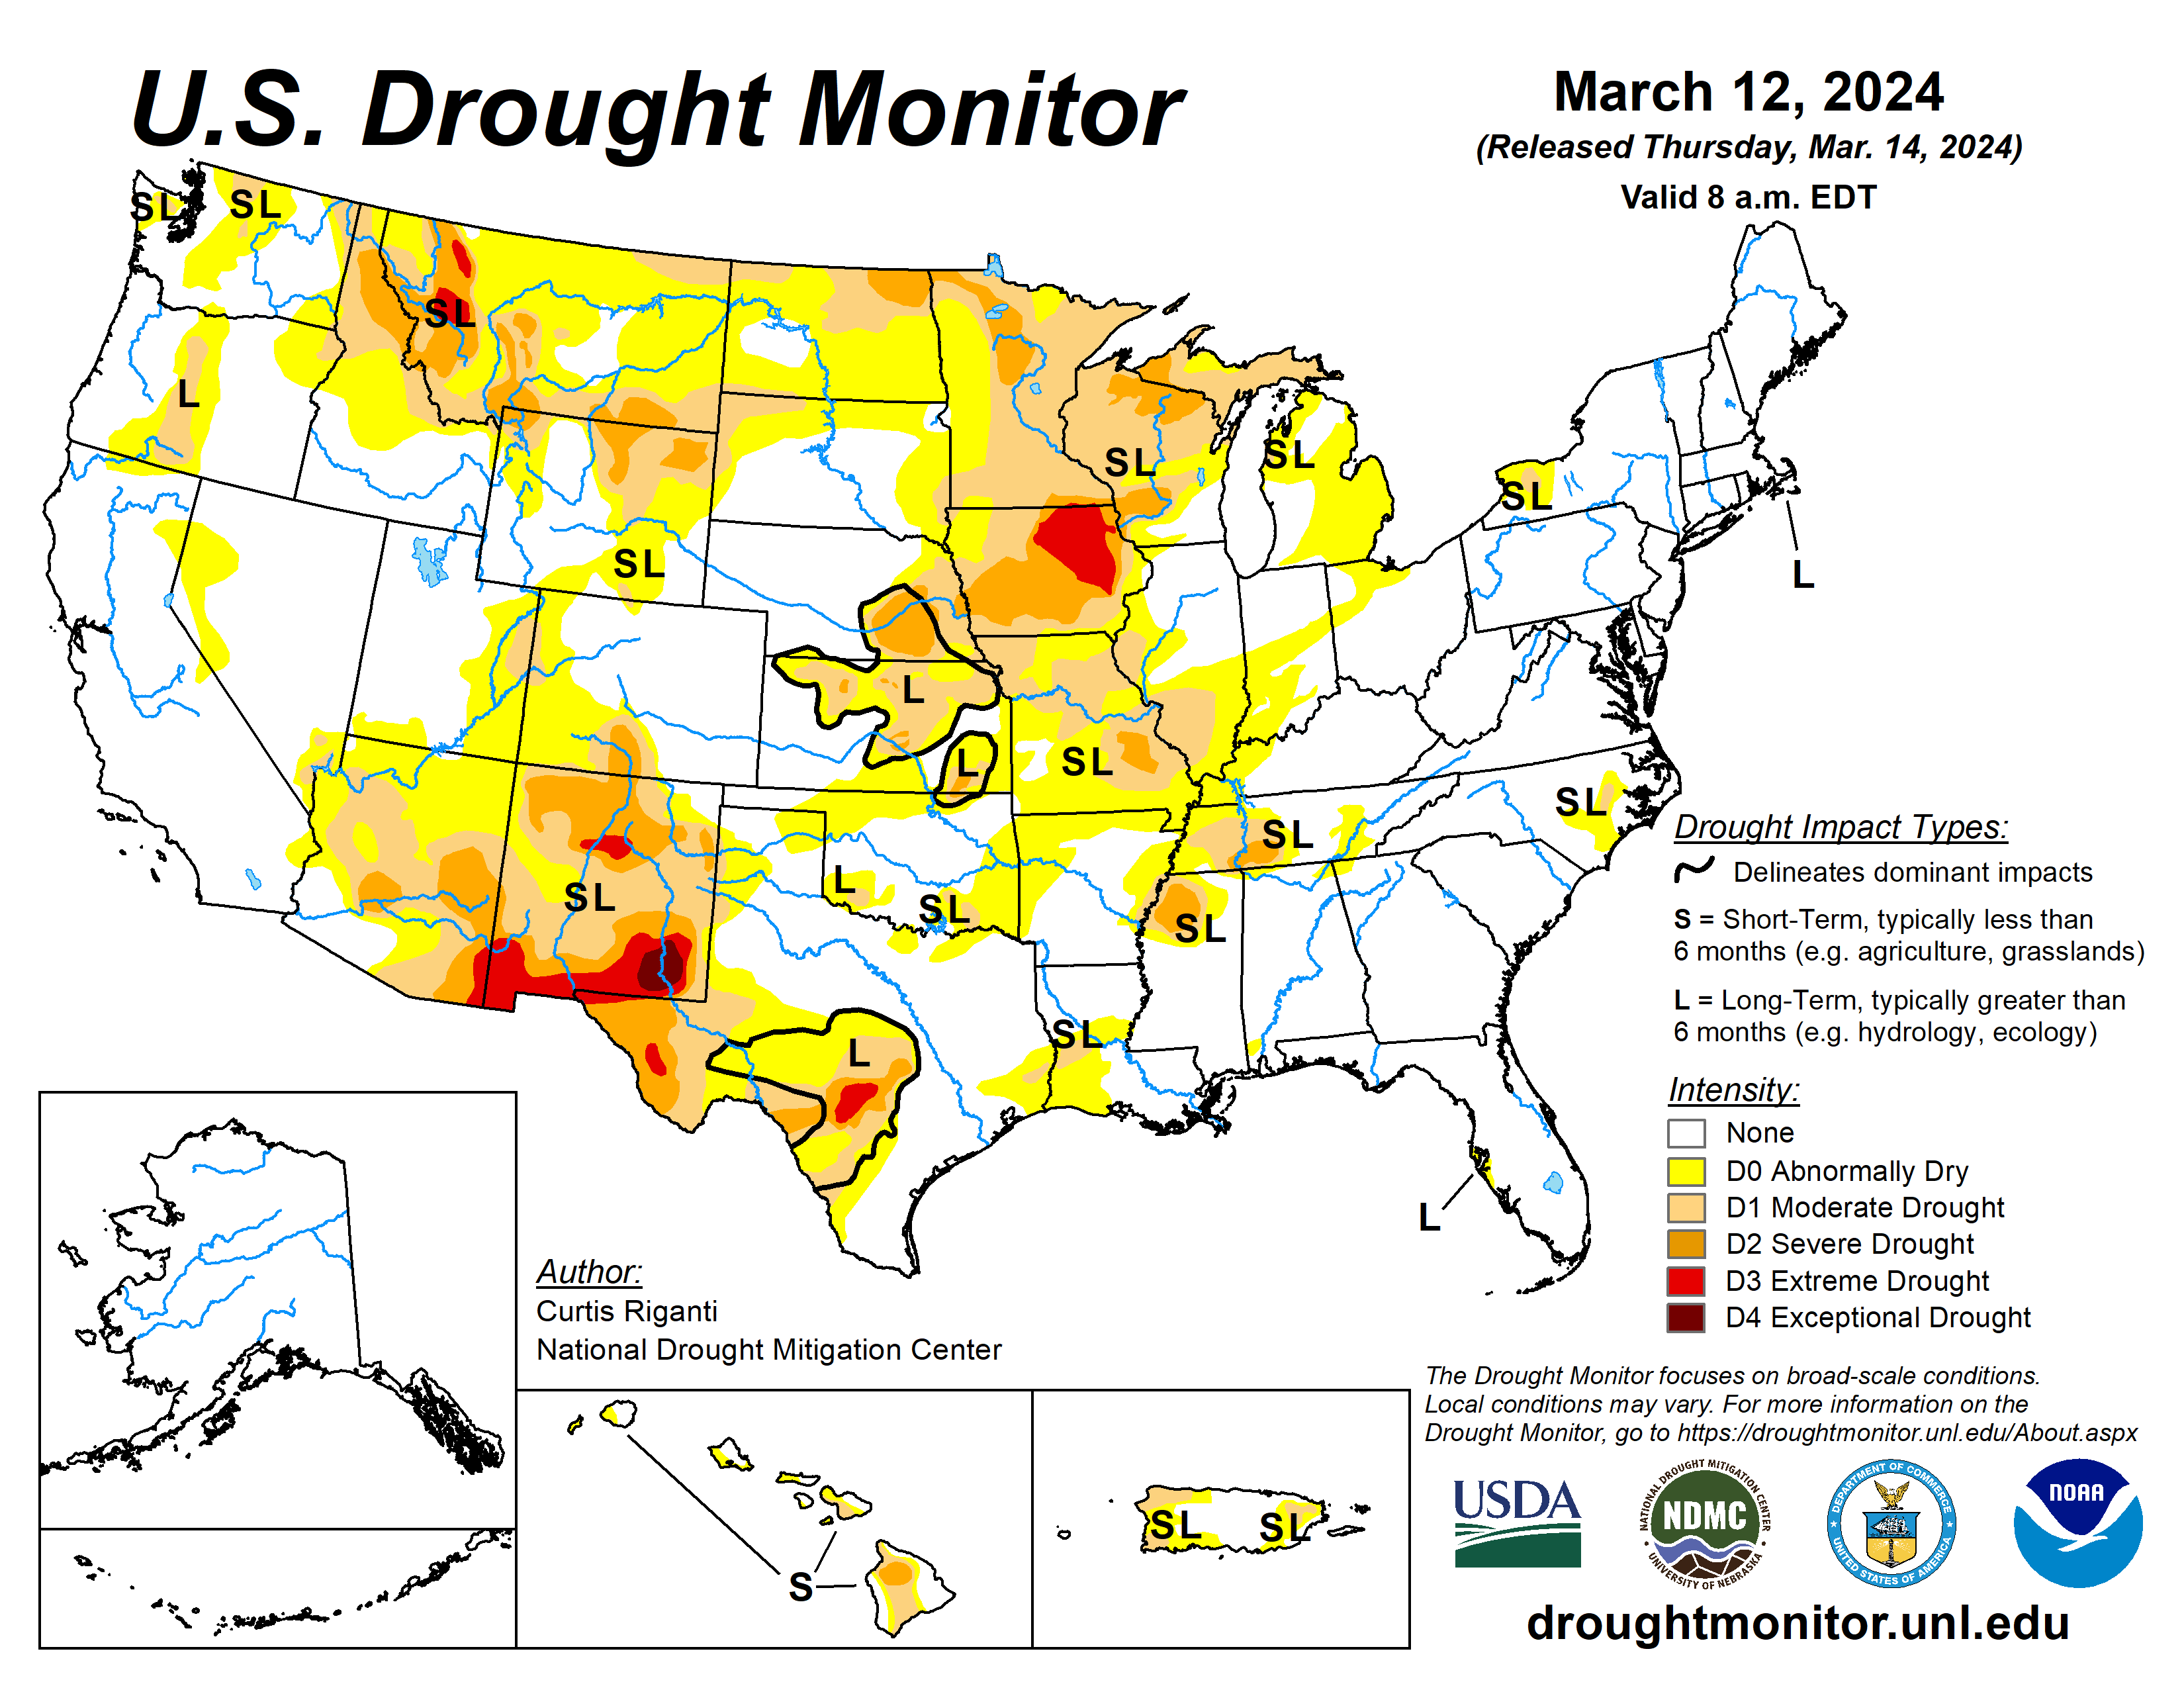 |
Short and long term precipitation deficits, warm and windy recent weather, and low soil moisture and groundwater levels led to localized expansion of extreme drought in central Iowa. In southeast Iowa, despite wetter weather in January creeks, rivers, and pond levels are still low, indicative of the short and long term significant drougth conditions across much of Iowa and eastern Illinois. Abnormally dry (D0) conditions persist in Mercer county. Moderate drought persists in western Illinois and further south over southern Illinois. Worse conditions persist in parts of central and northeast Iowa. Extreme drought continues over a large part of north central and northeast Iowa.
 |
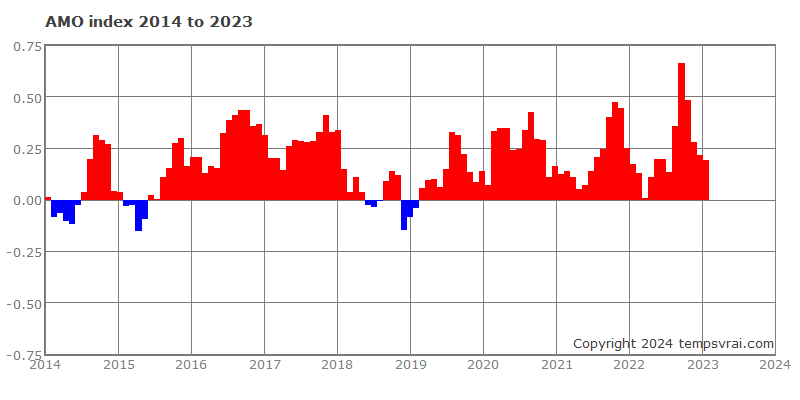 |
The Atlantic Multi Oscillation Index is a measure of North Atlantic Ocean temperatures. It is a warm phase now and has been for some time. The AMO has affected air temperatures and rainfall over much of the Northern Hemisphere, in particular North Amercia and Europe. Research suggest that the when the AMO is in its warm phase droughts in North America tend to be more frequent and/or more severe. Two of the most severe droughts occuring in the 1930s and 1950s occurred during the warm phase od the AMO.
If the drought conditions persist this
Could disrupt the traditional planting schedules.
cause a shift in crop selection and farming practices.
such as cover crops and reduced tillage
Increase efforts to help preserve soil moisture and soil fertility
|
 |
 |
This is a animation of the Jet Stream at the 500mb level for the next 1-2 weeks. See the Jet Stream lower southward over the Eastern United States pushing colder and drier air into the east and midwest..
|
 |
 |
|
 |
 |
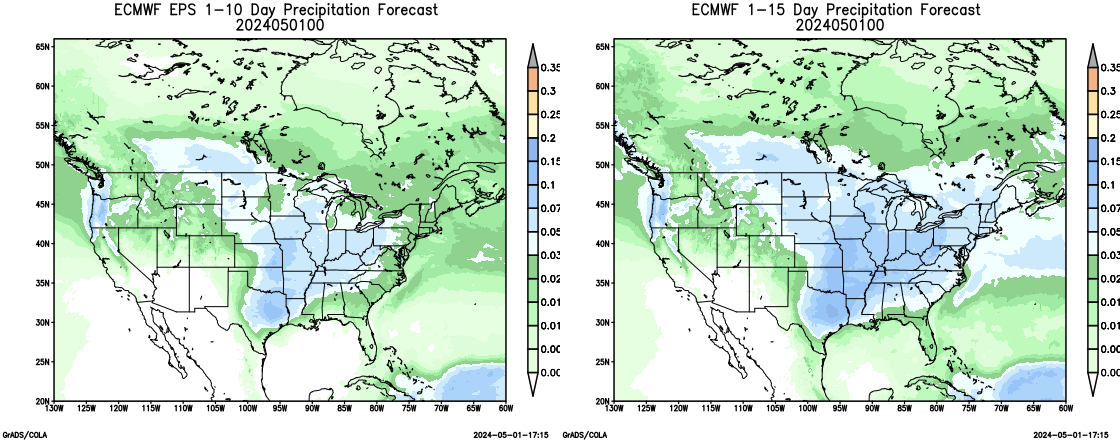 |
These two maps show the ECMWF EPS (Ensemble model) show the most likely precipitation for the US over the next 1-10 Days and 1-15 Days. |
|
 |
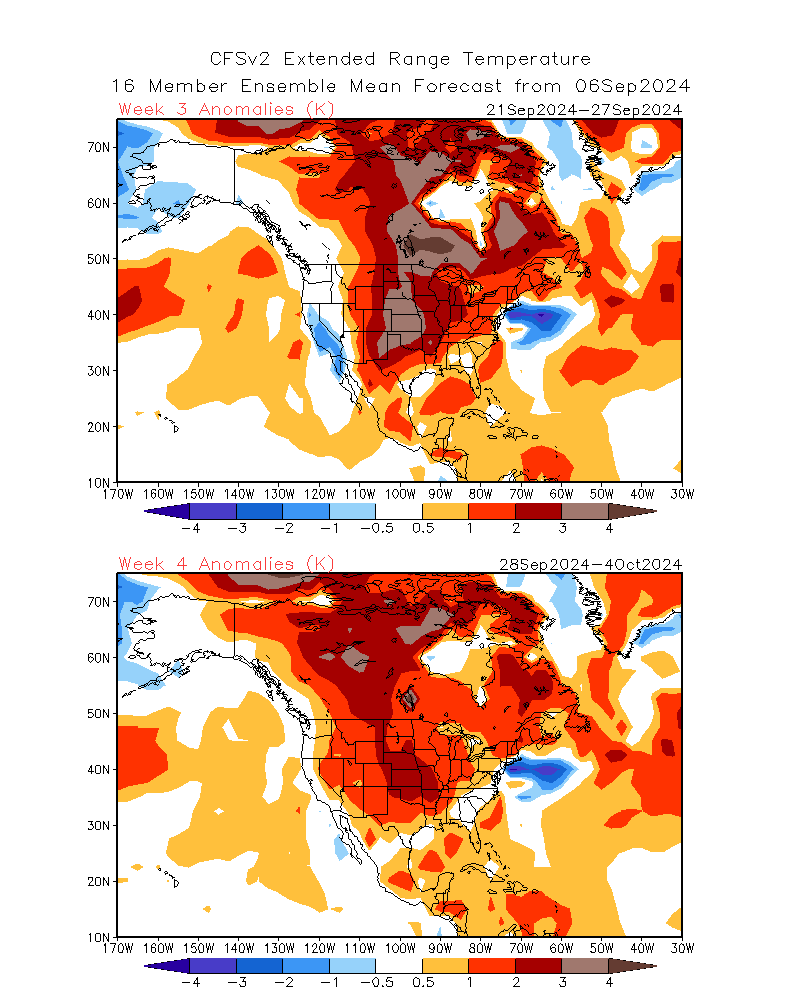
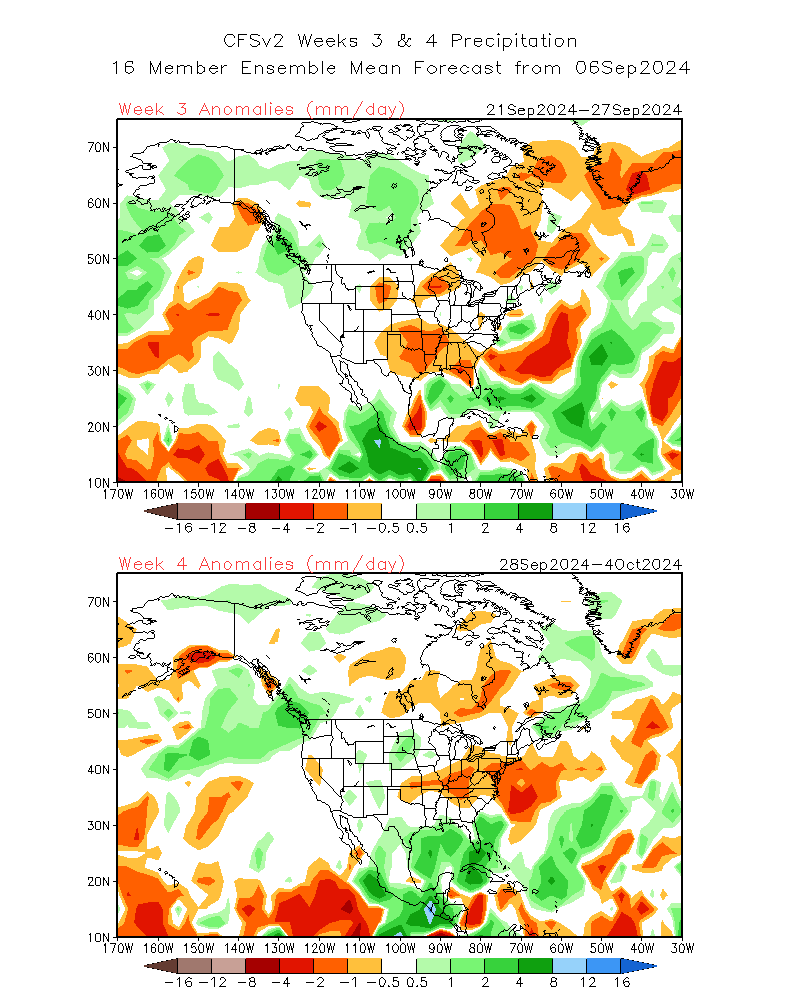
These maps show the CFSv2 model forecasting average temperature and precipitation for the US for the 3rd and 4th week. |
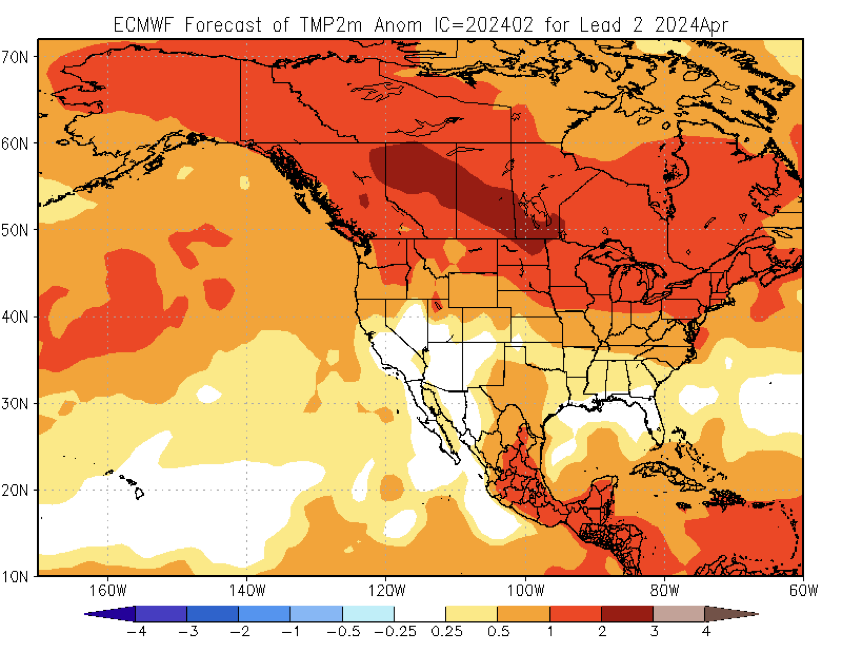 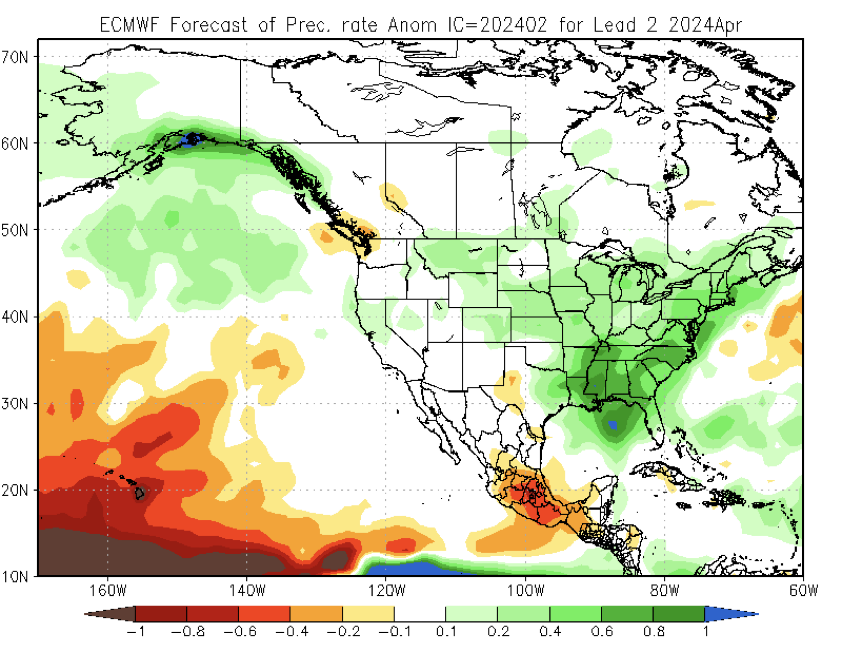 |
These maps are show the ECMWF models Outlook for April showing the Temperature and Precipitation Trend. |
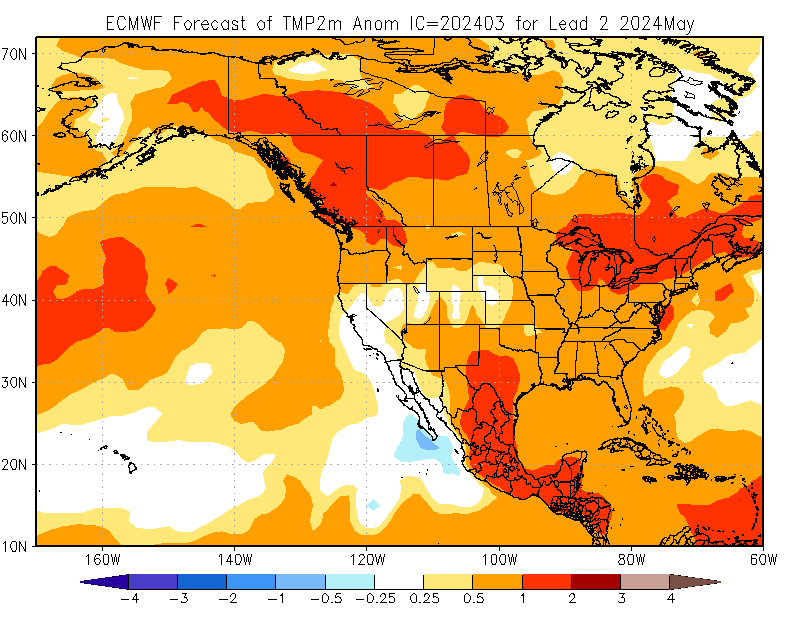 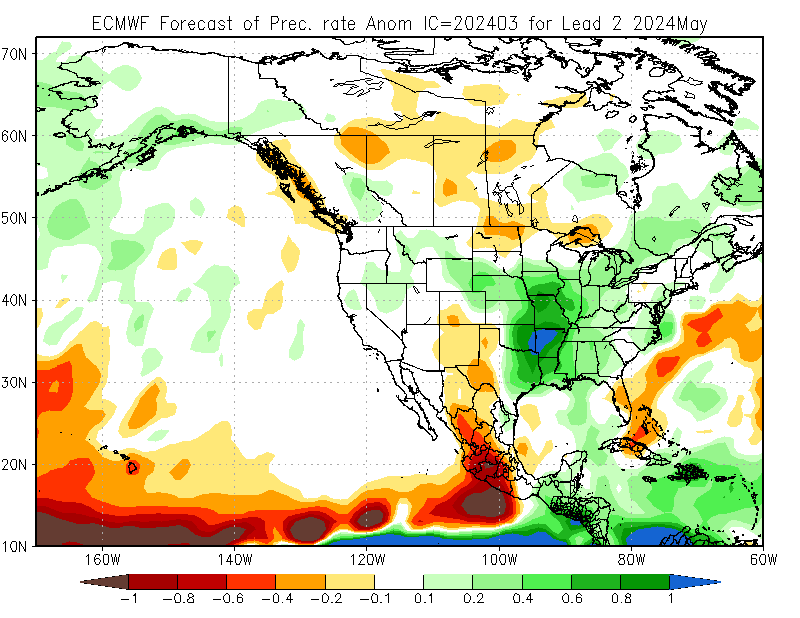 |
These maps are show the ECMWF models Outlook for May showing the Temperature and Precipitation Trend. |
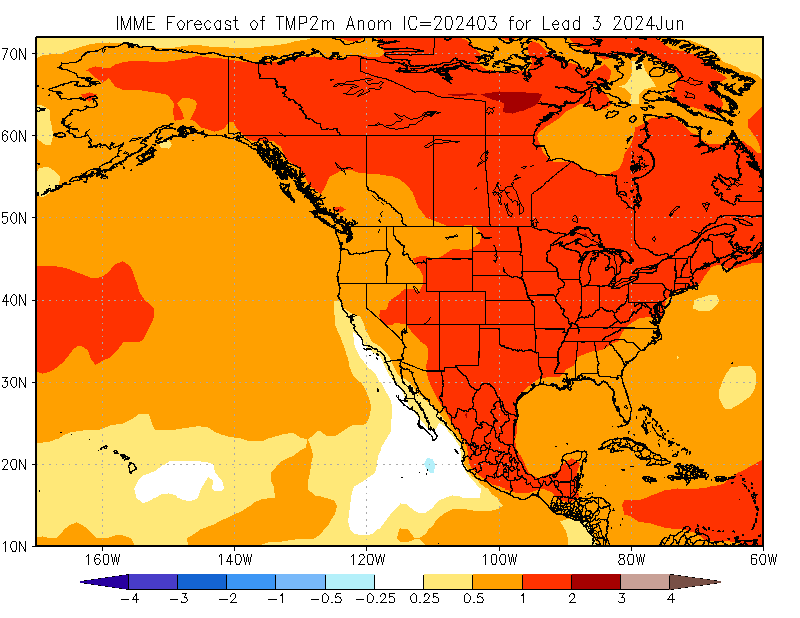 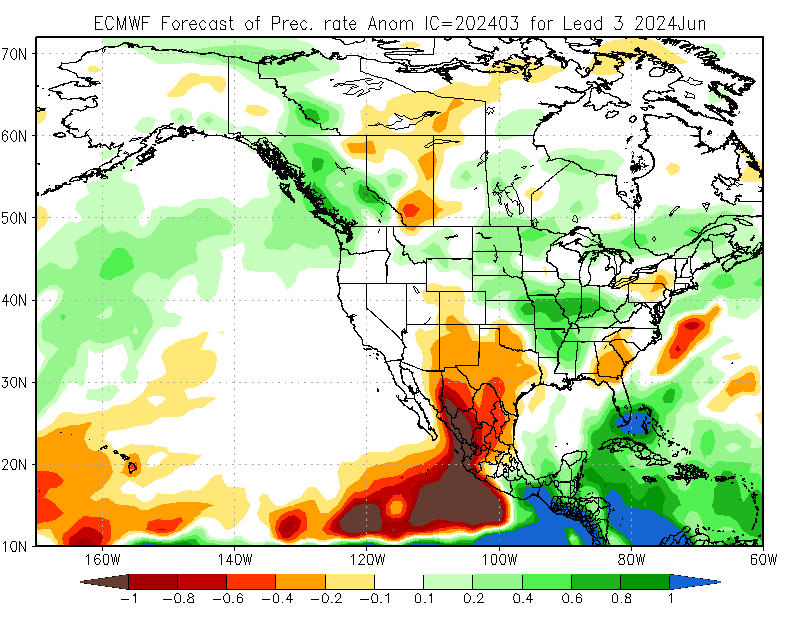 |
These maps are show the ECMWF models Outlook for June showing the Temperature and Precipitation Trend. |
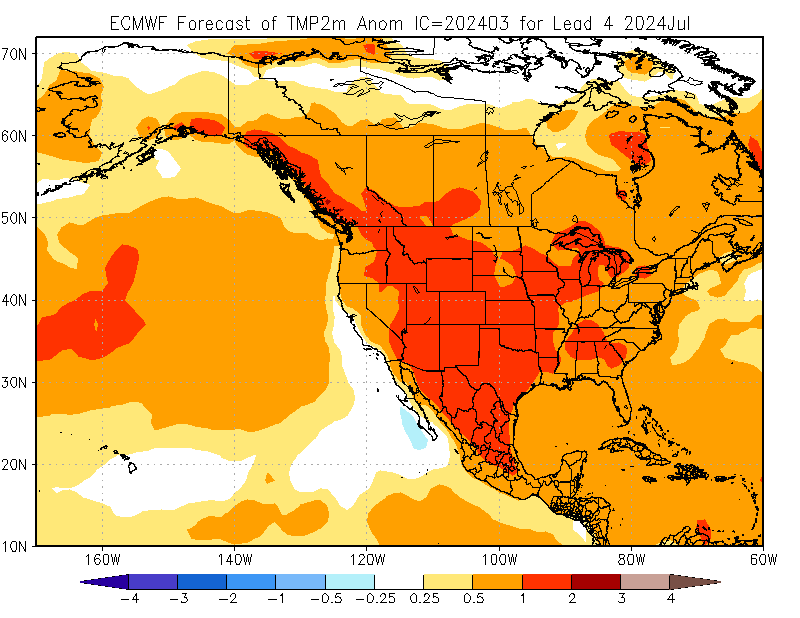 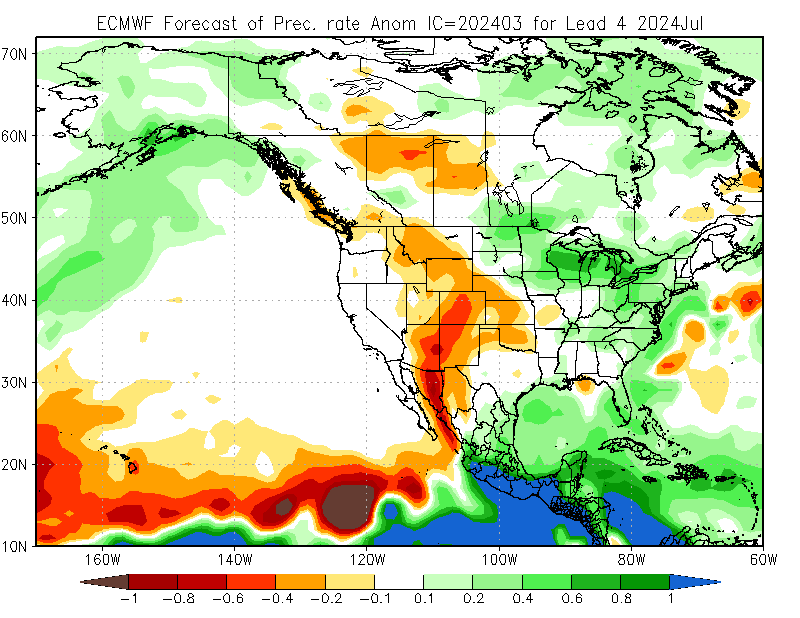 |
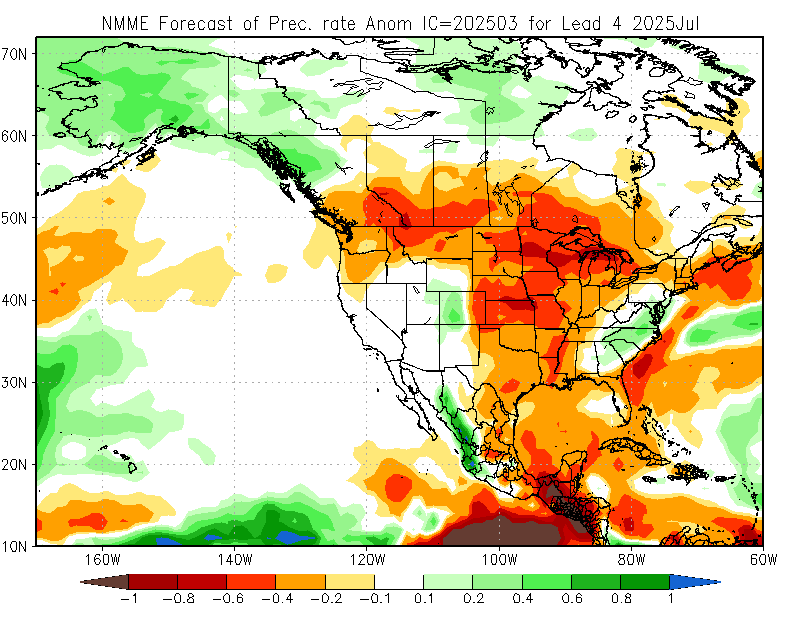
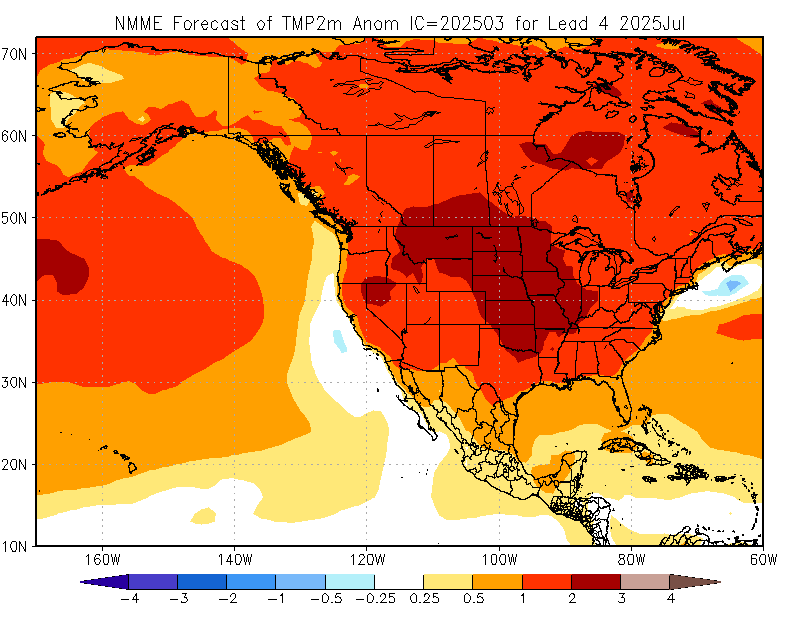
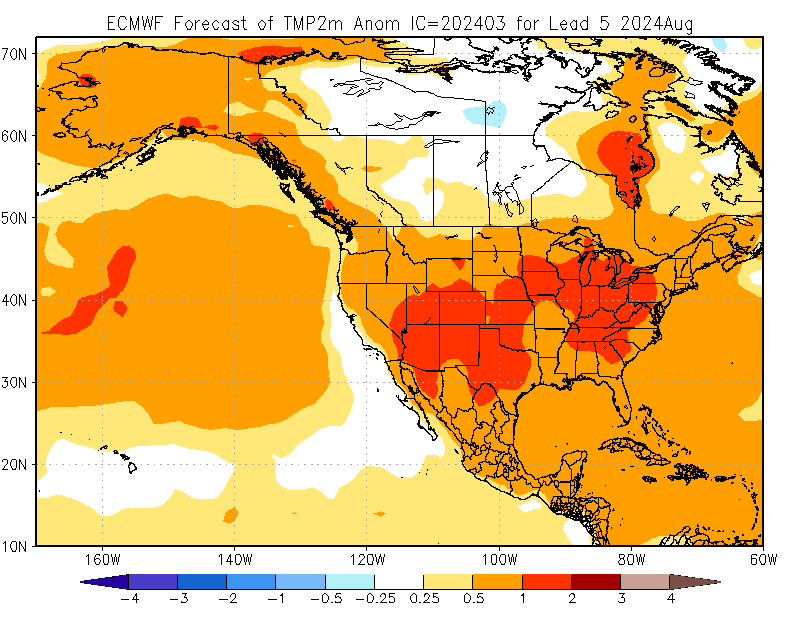
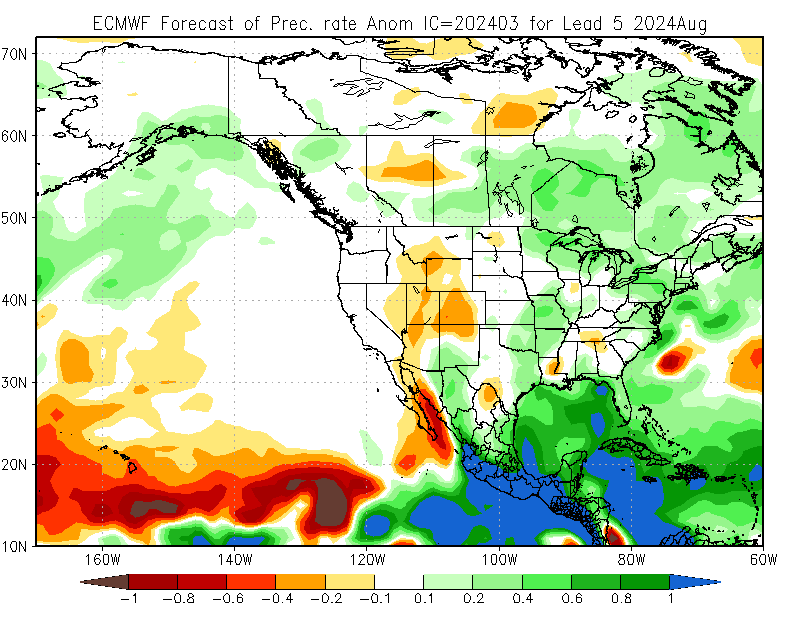
These maps are show the ECMWF models Outlook for July showing the Temperature and Precipitation Trend. |
  |
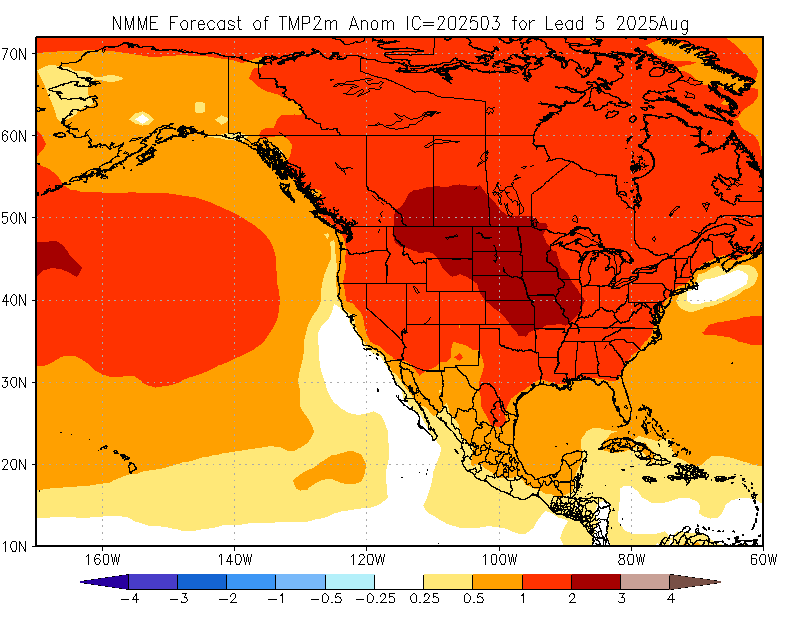
These maps are show the CFSv2 models Outlook for August showing the Temperature and Precipitation Trend. |
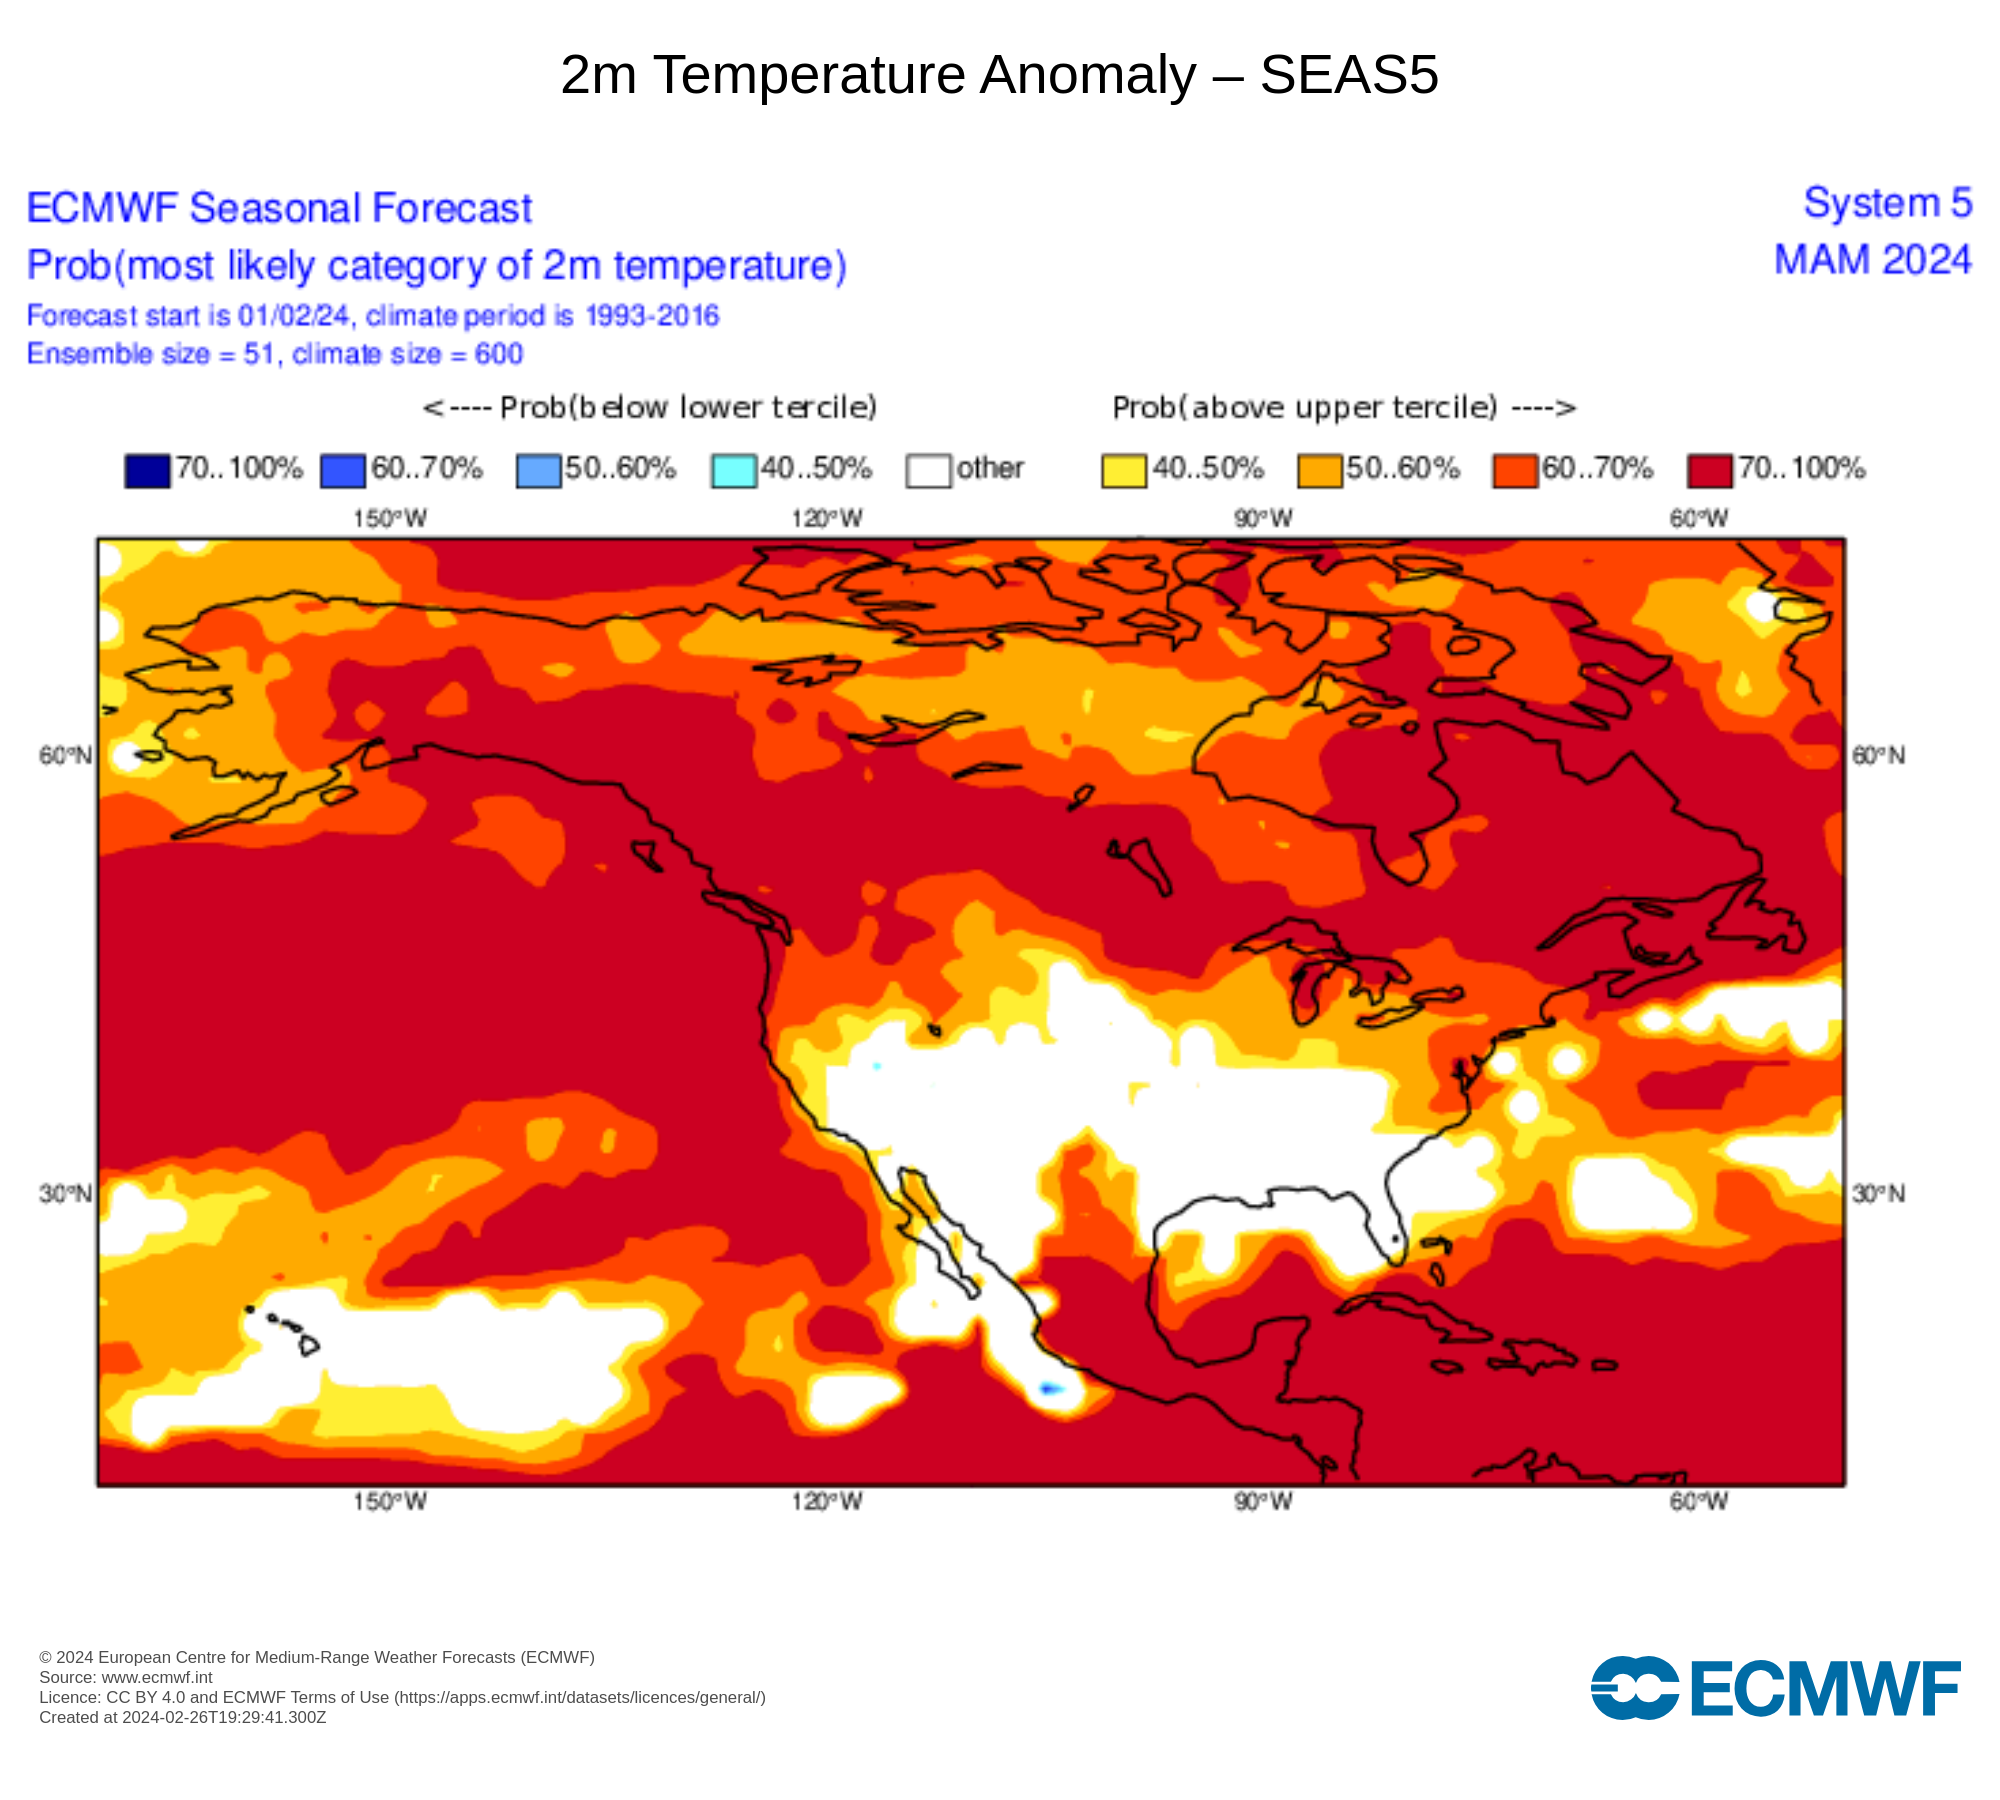 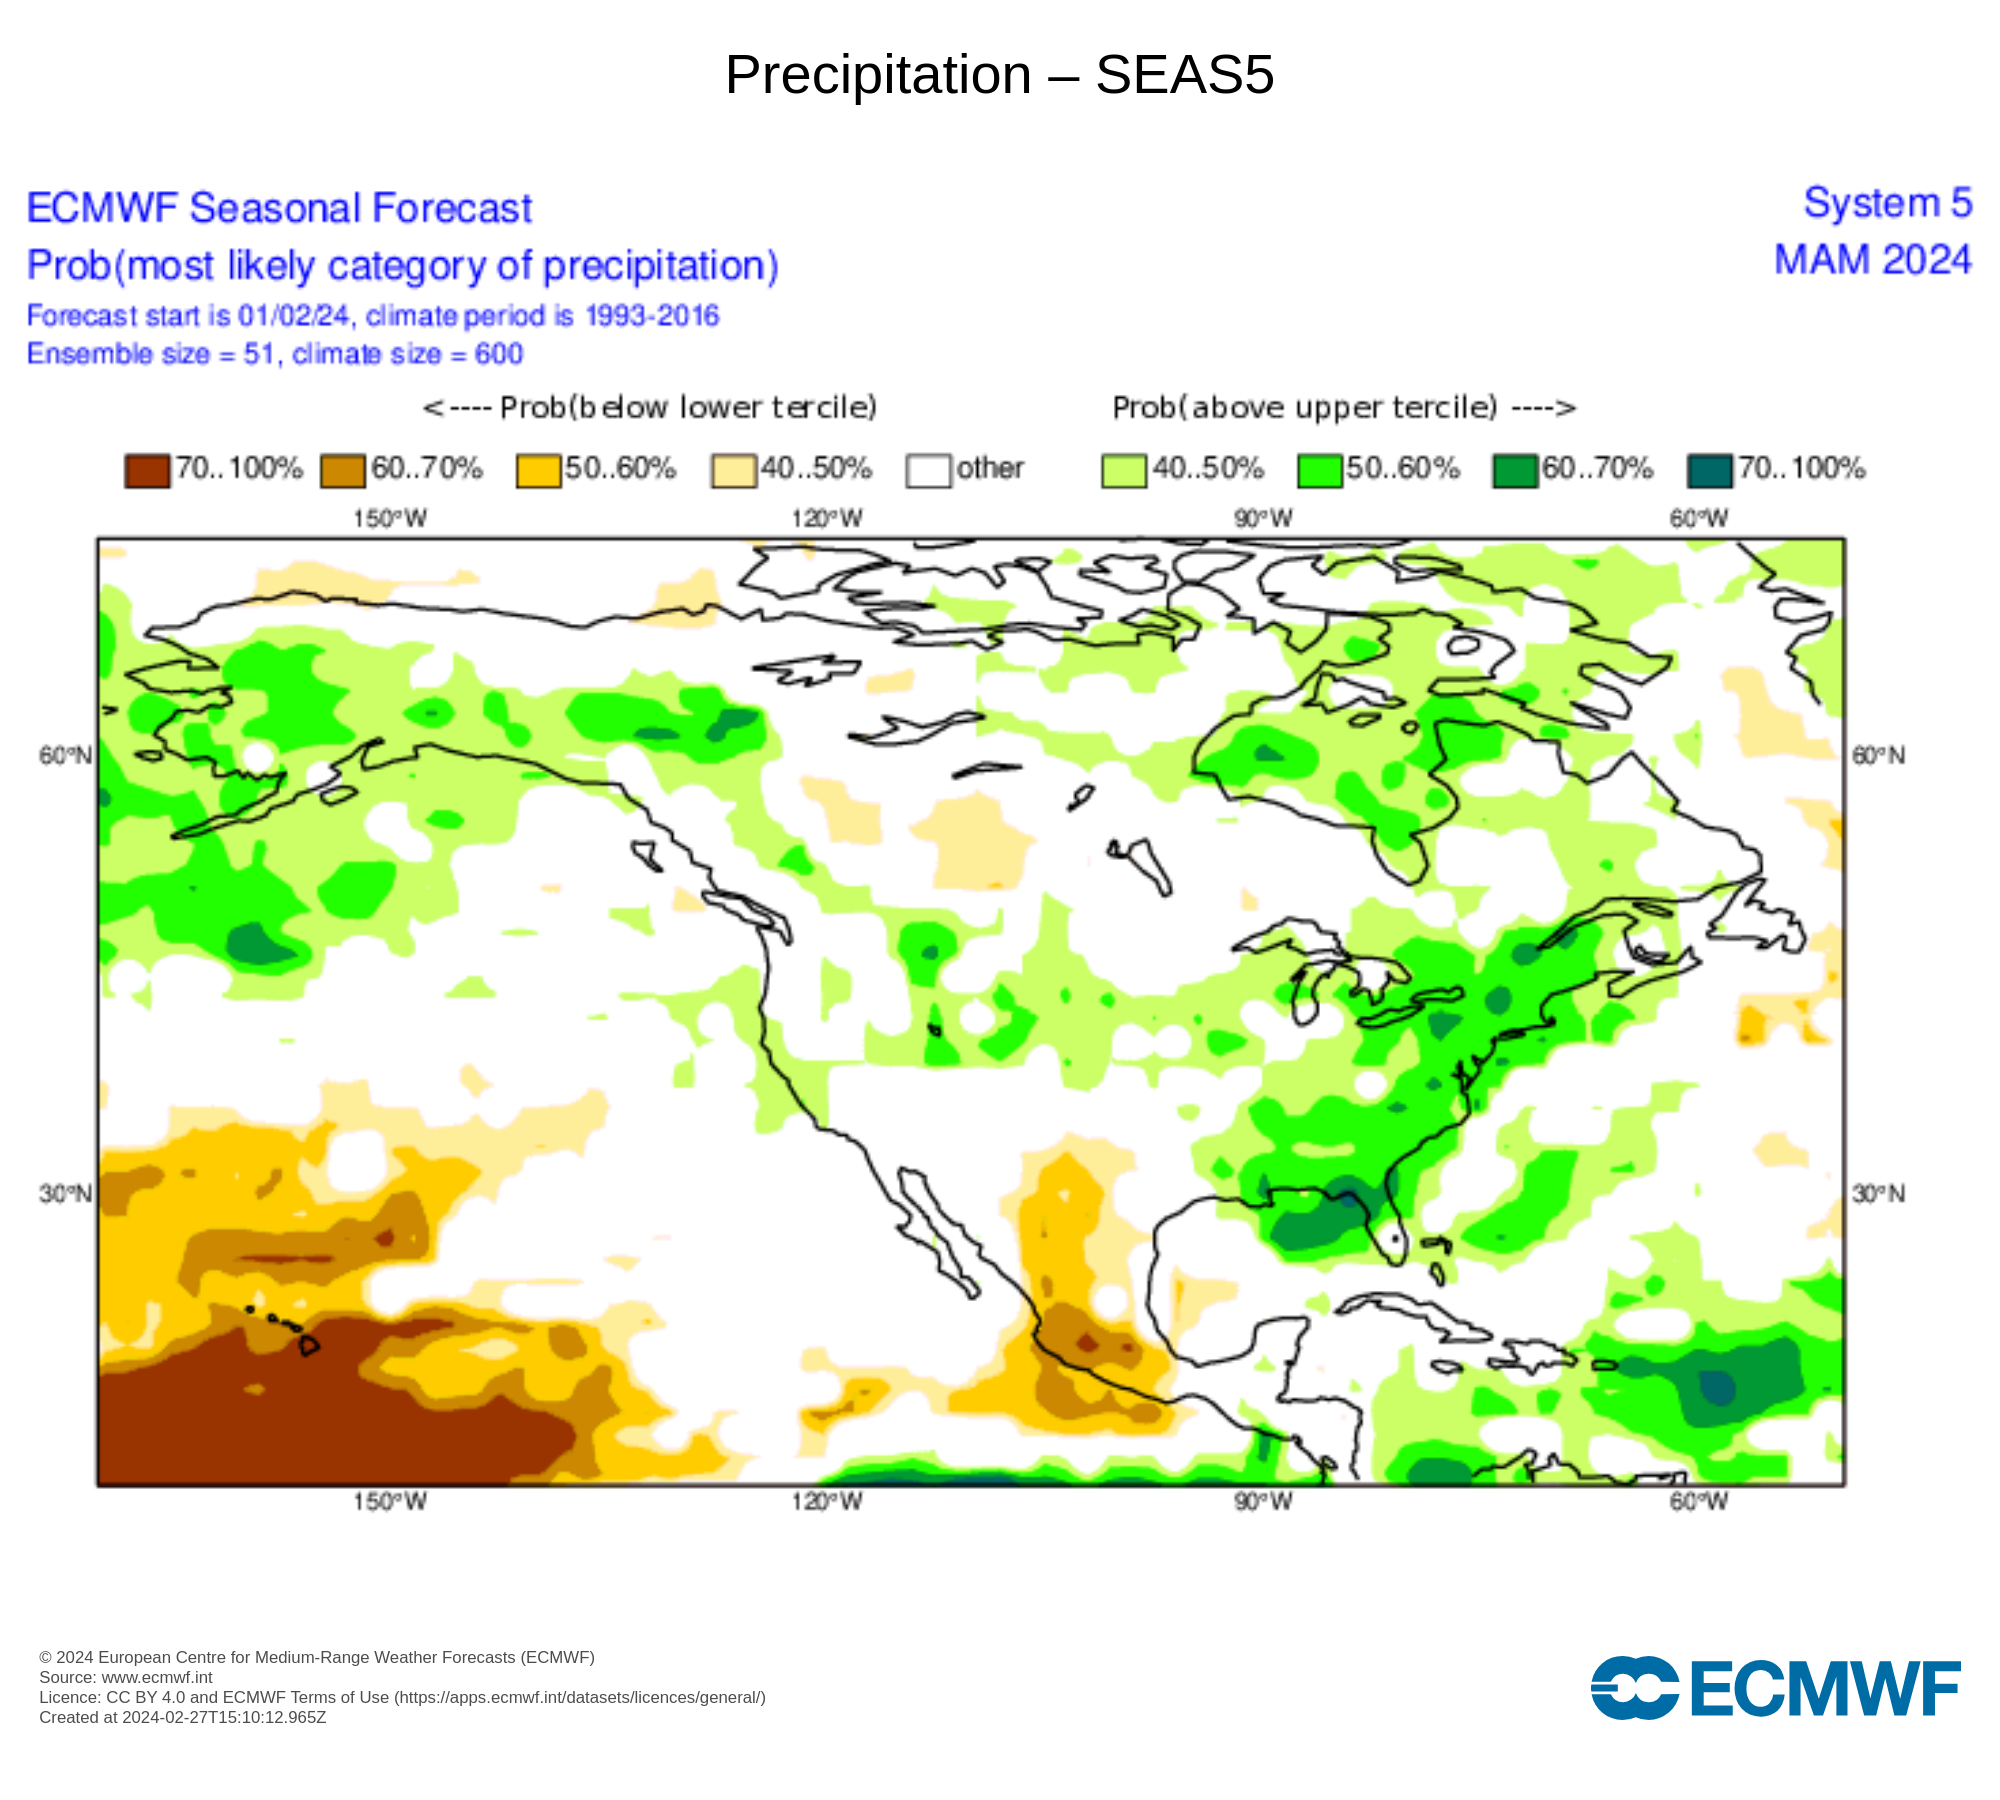 |
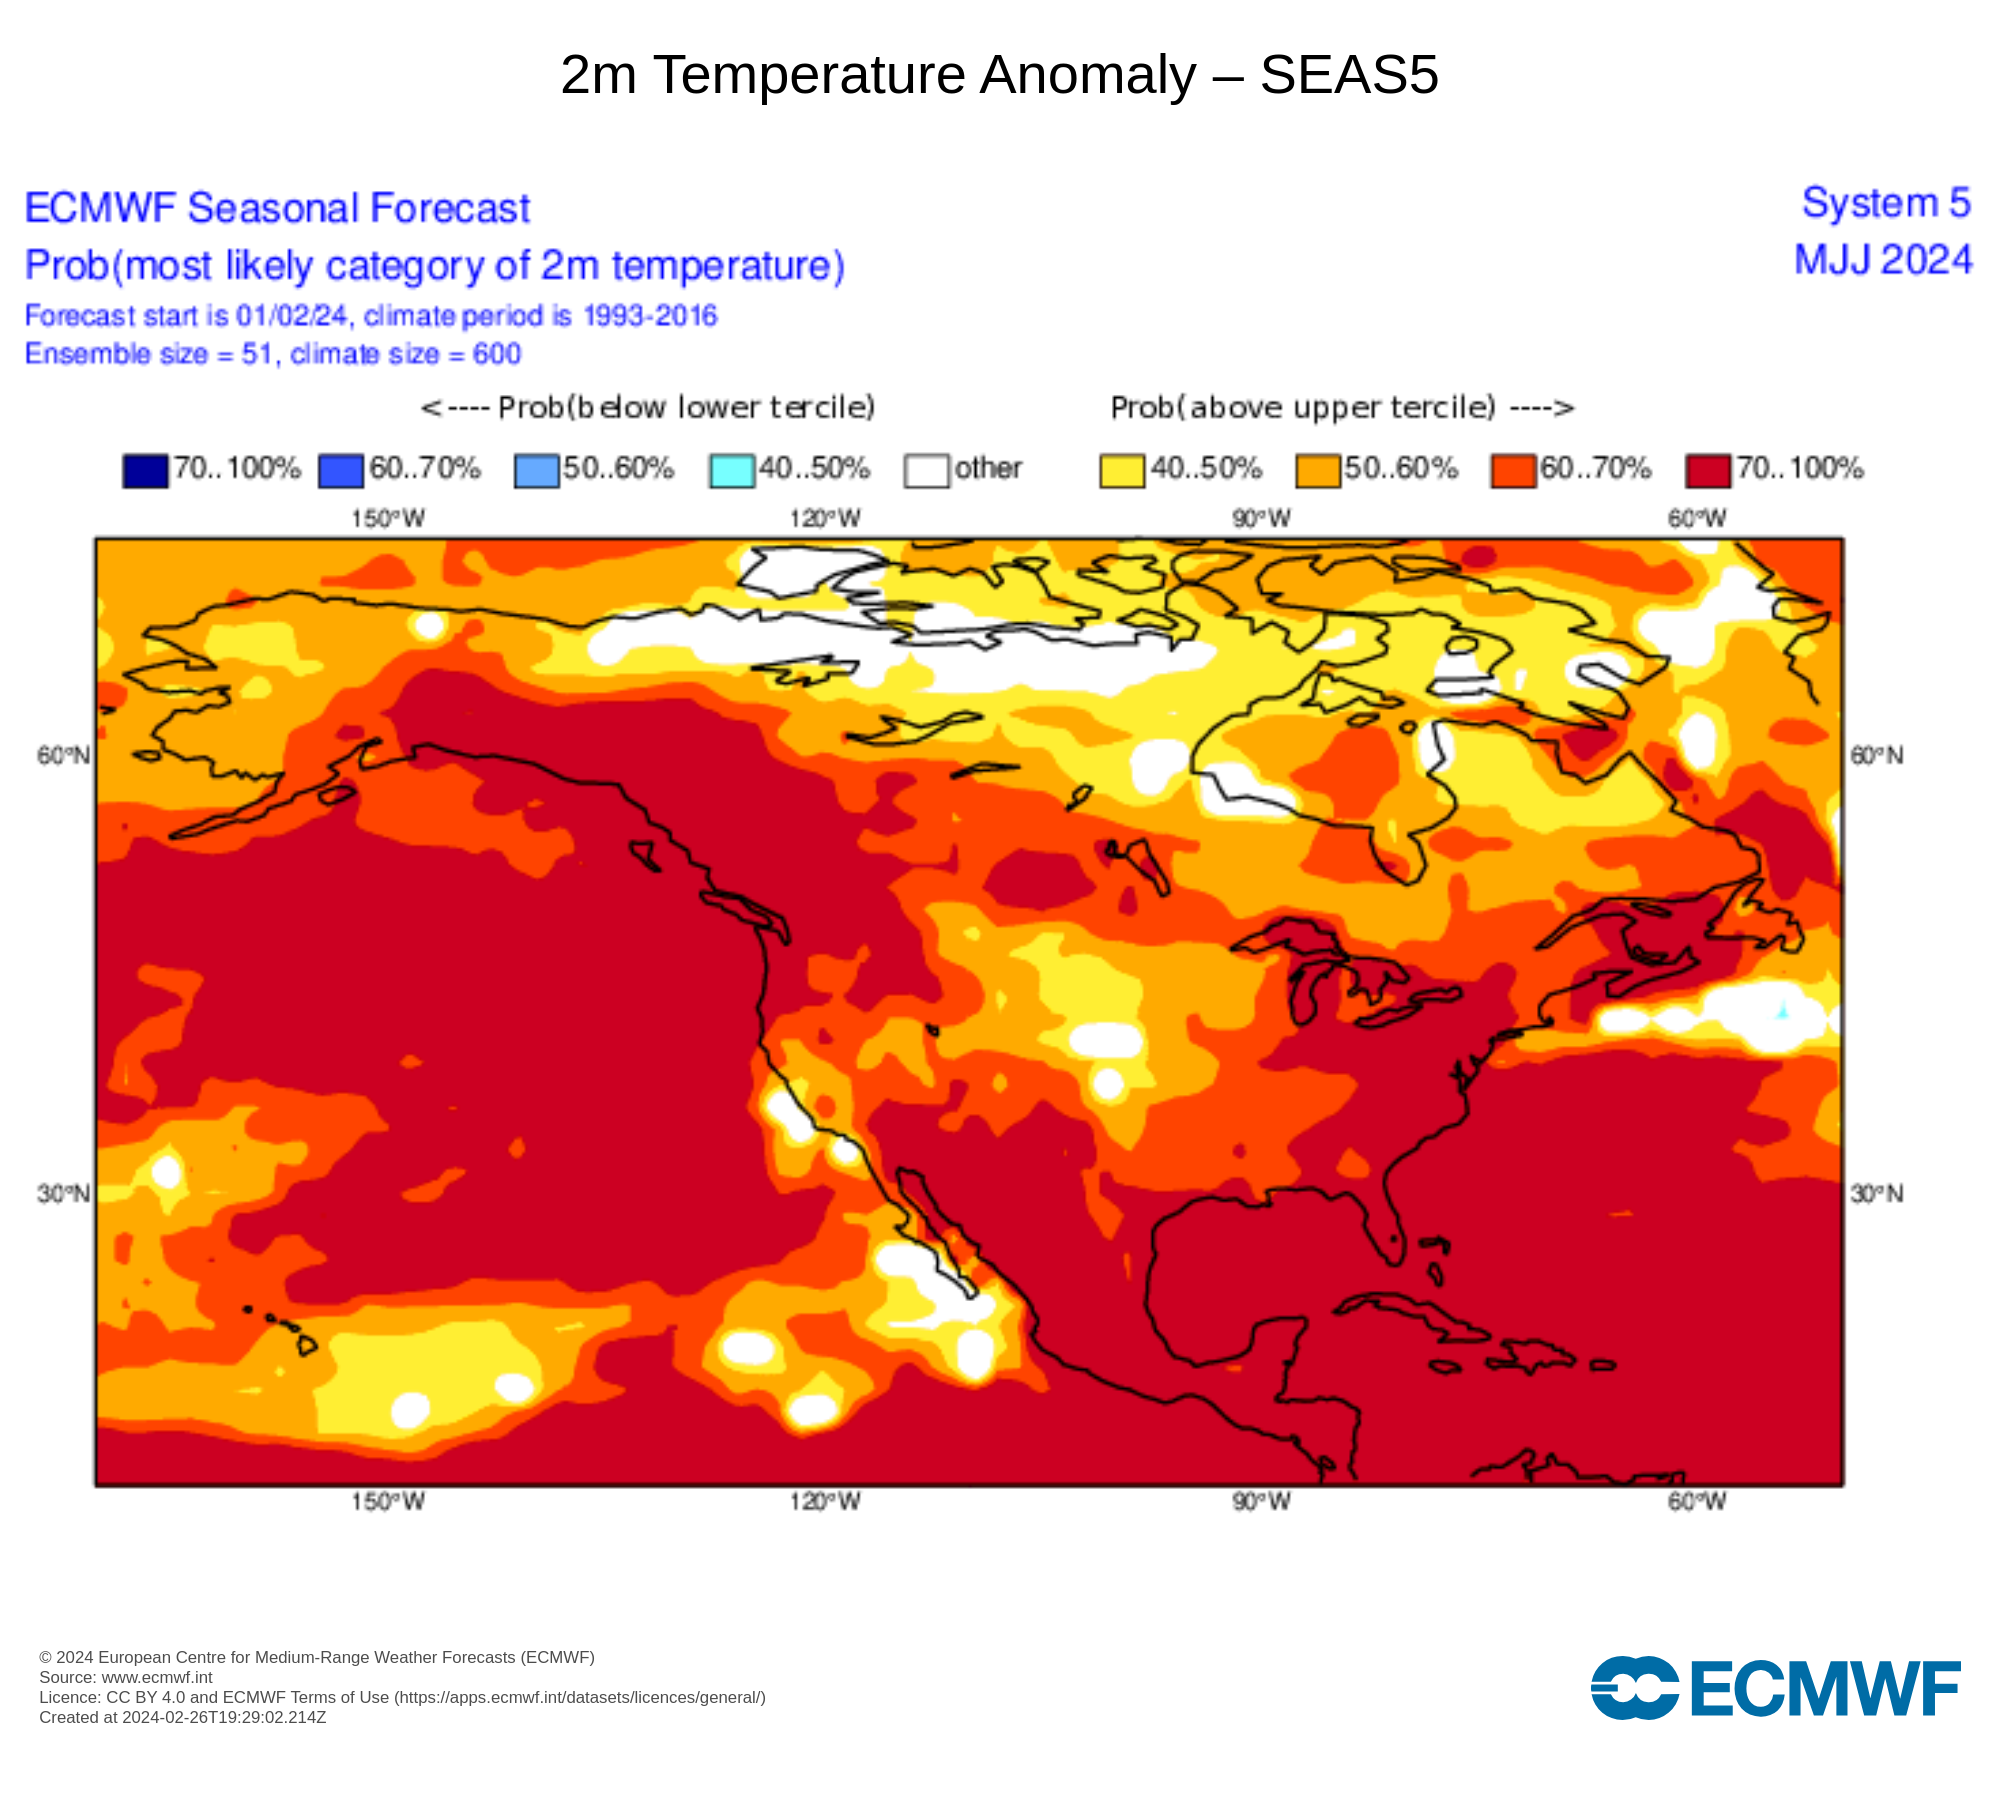
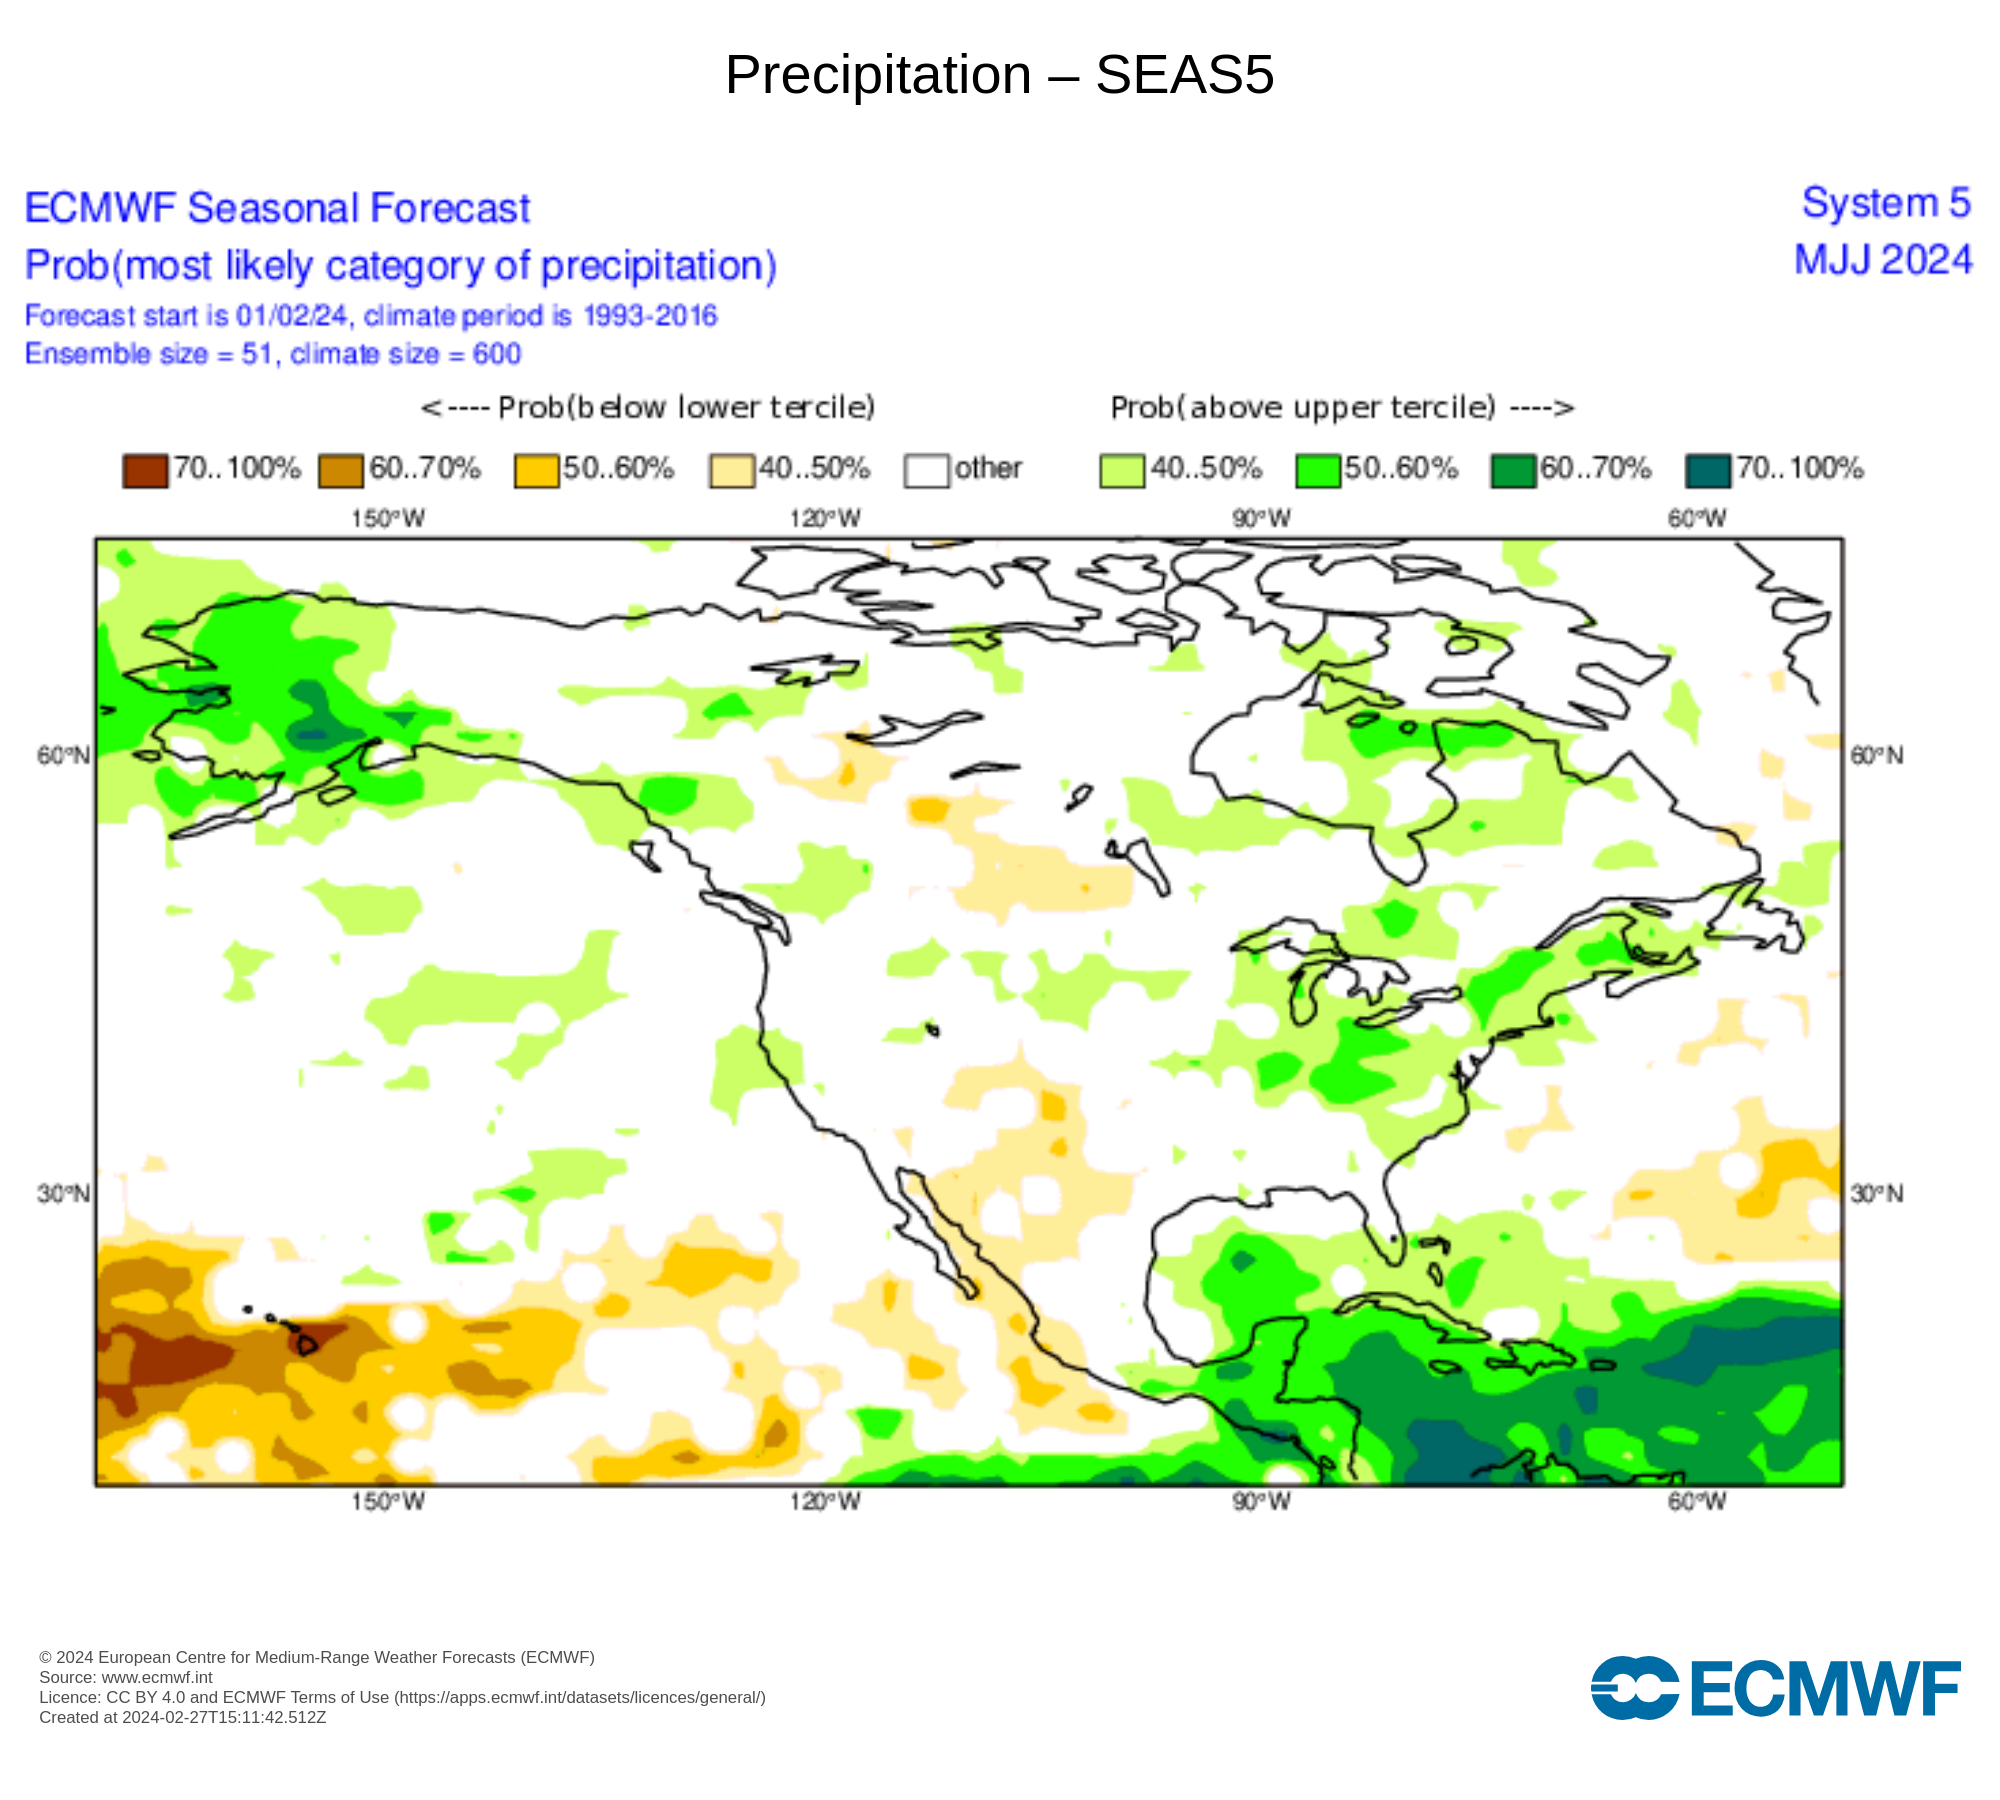
These maps are Seasonal Outlooks from the ECMWF models for March-April-May showing the Probable Temperature and Precipitation Trend. |
  |
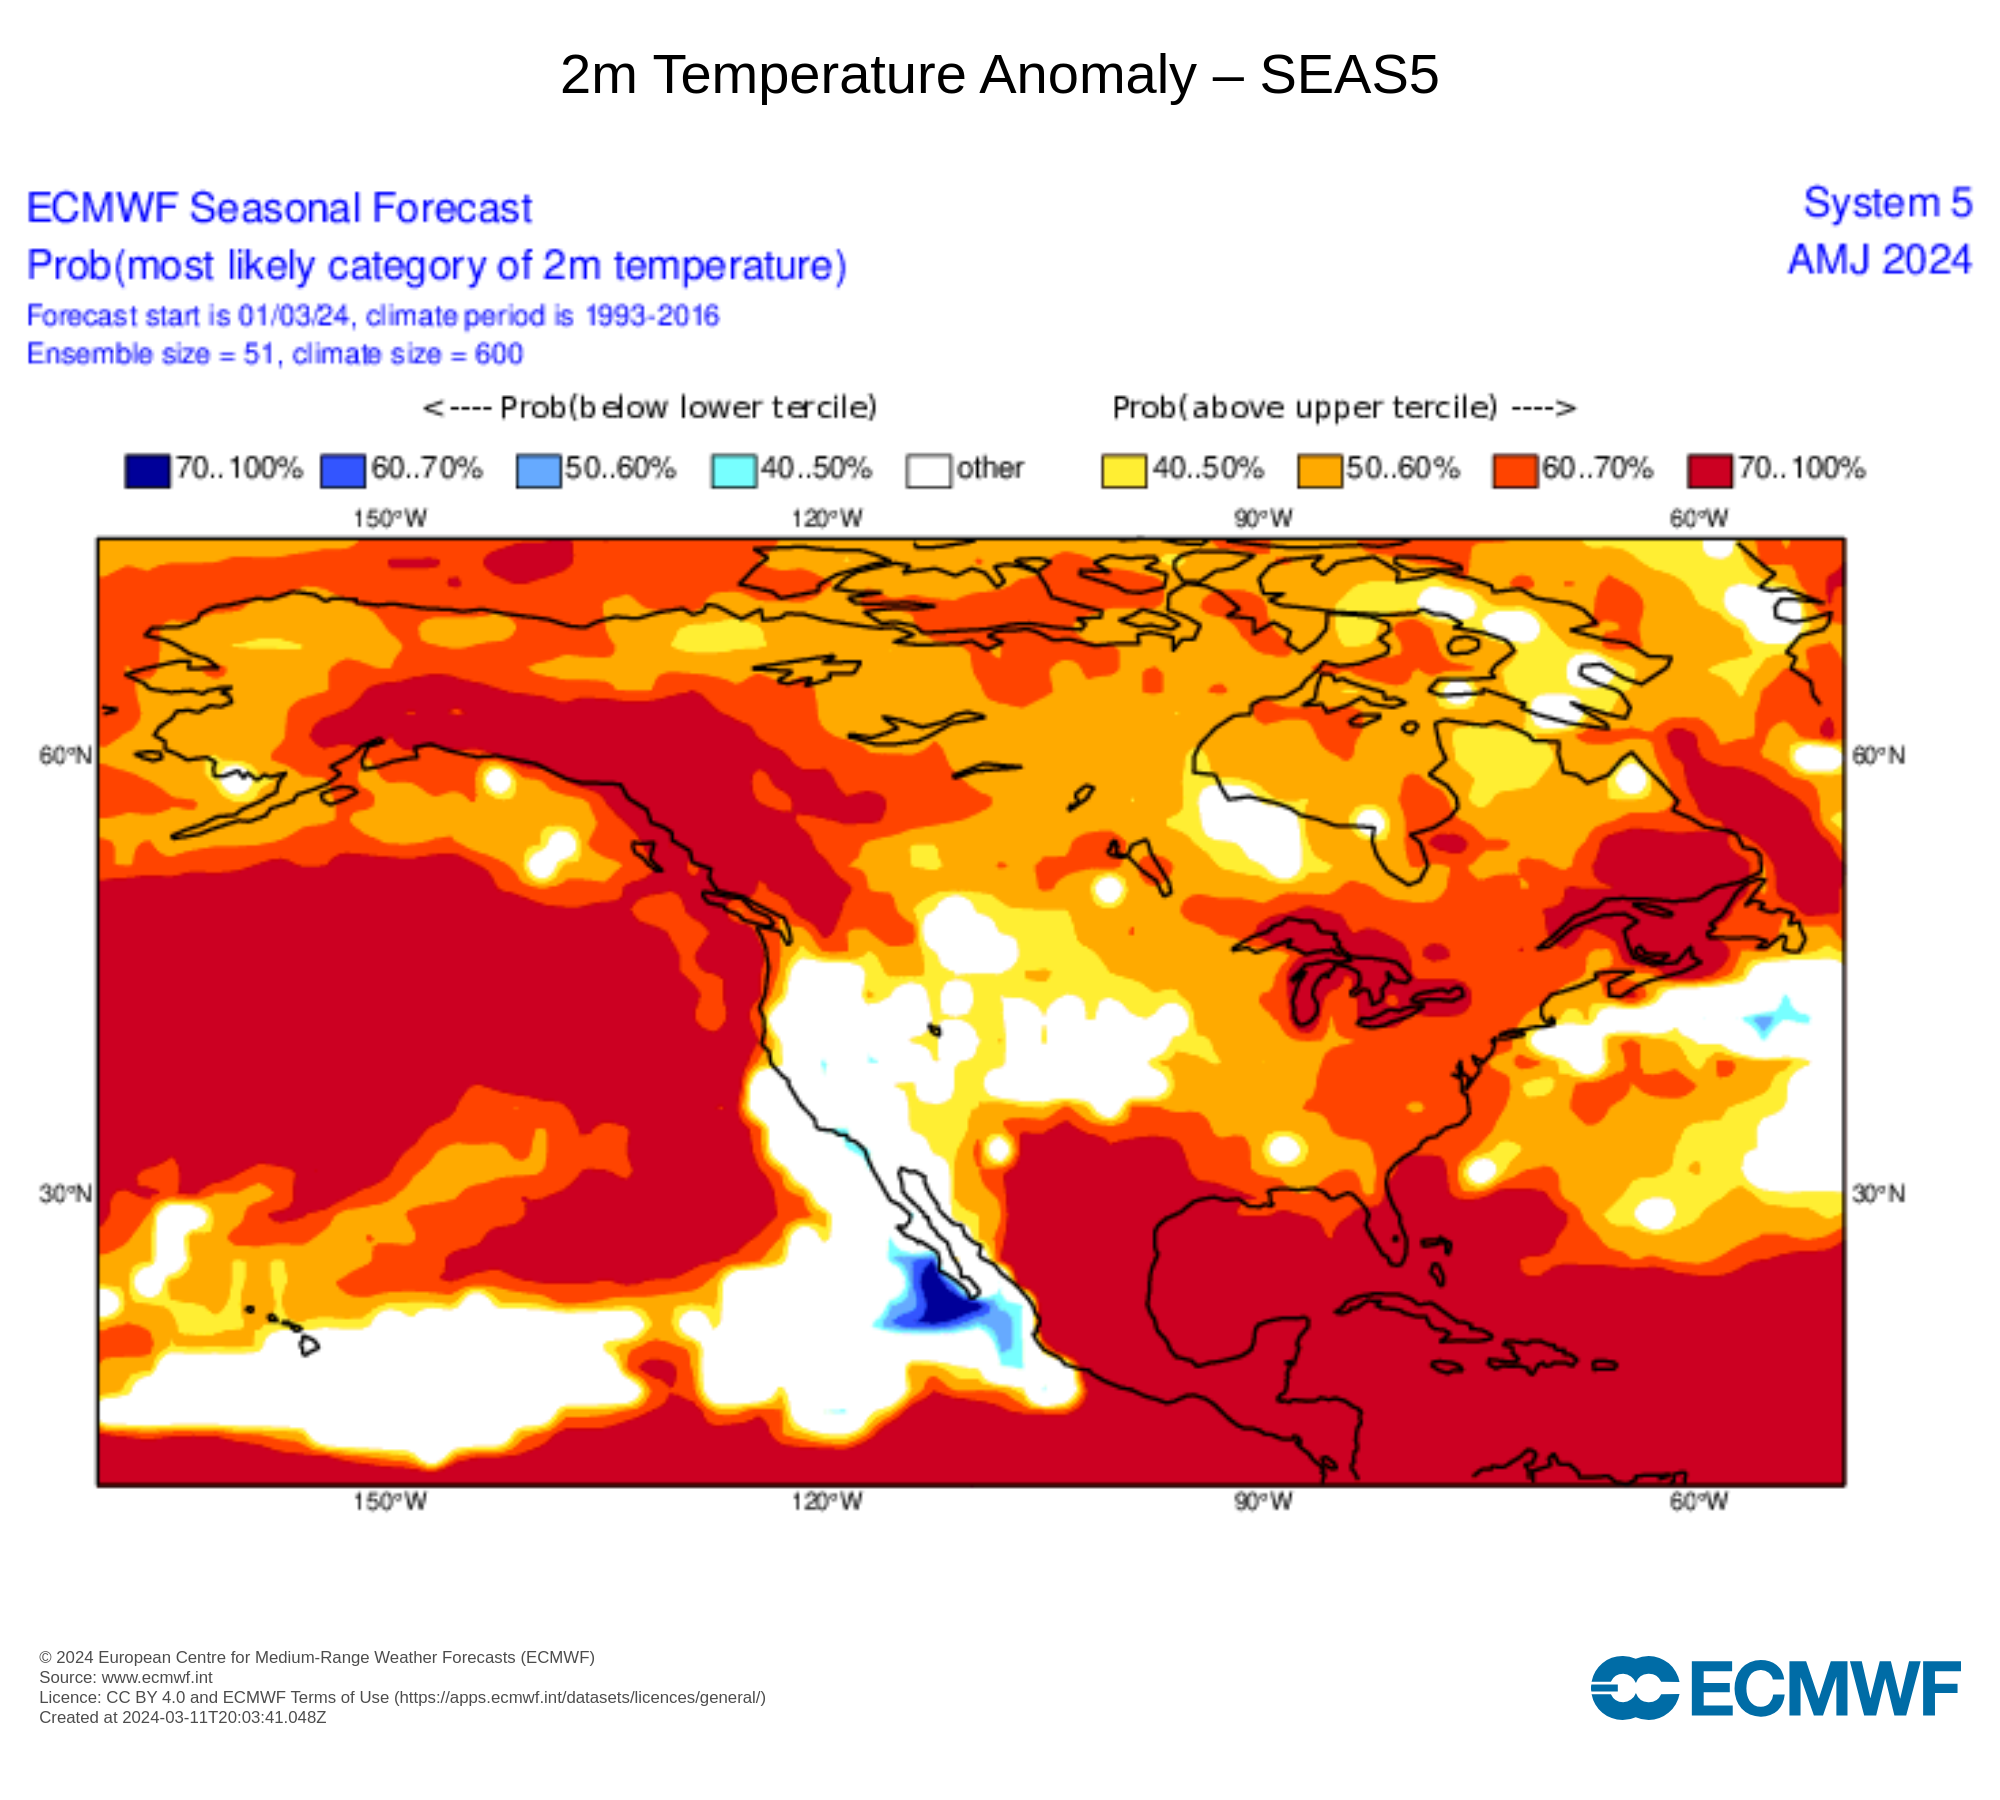 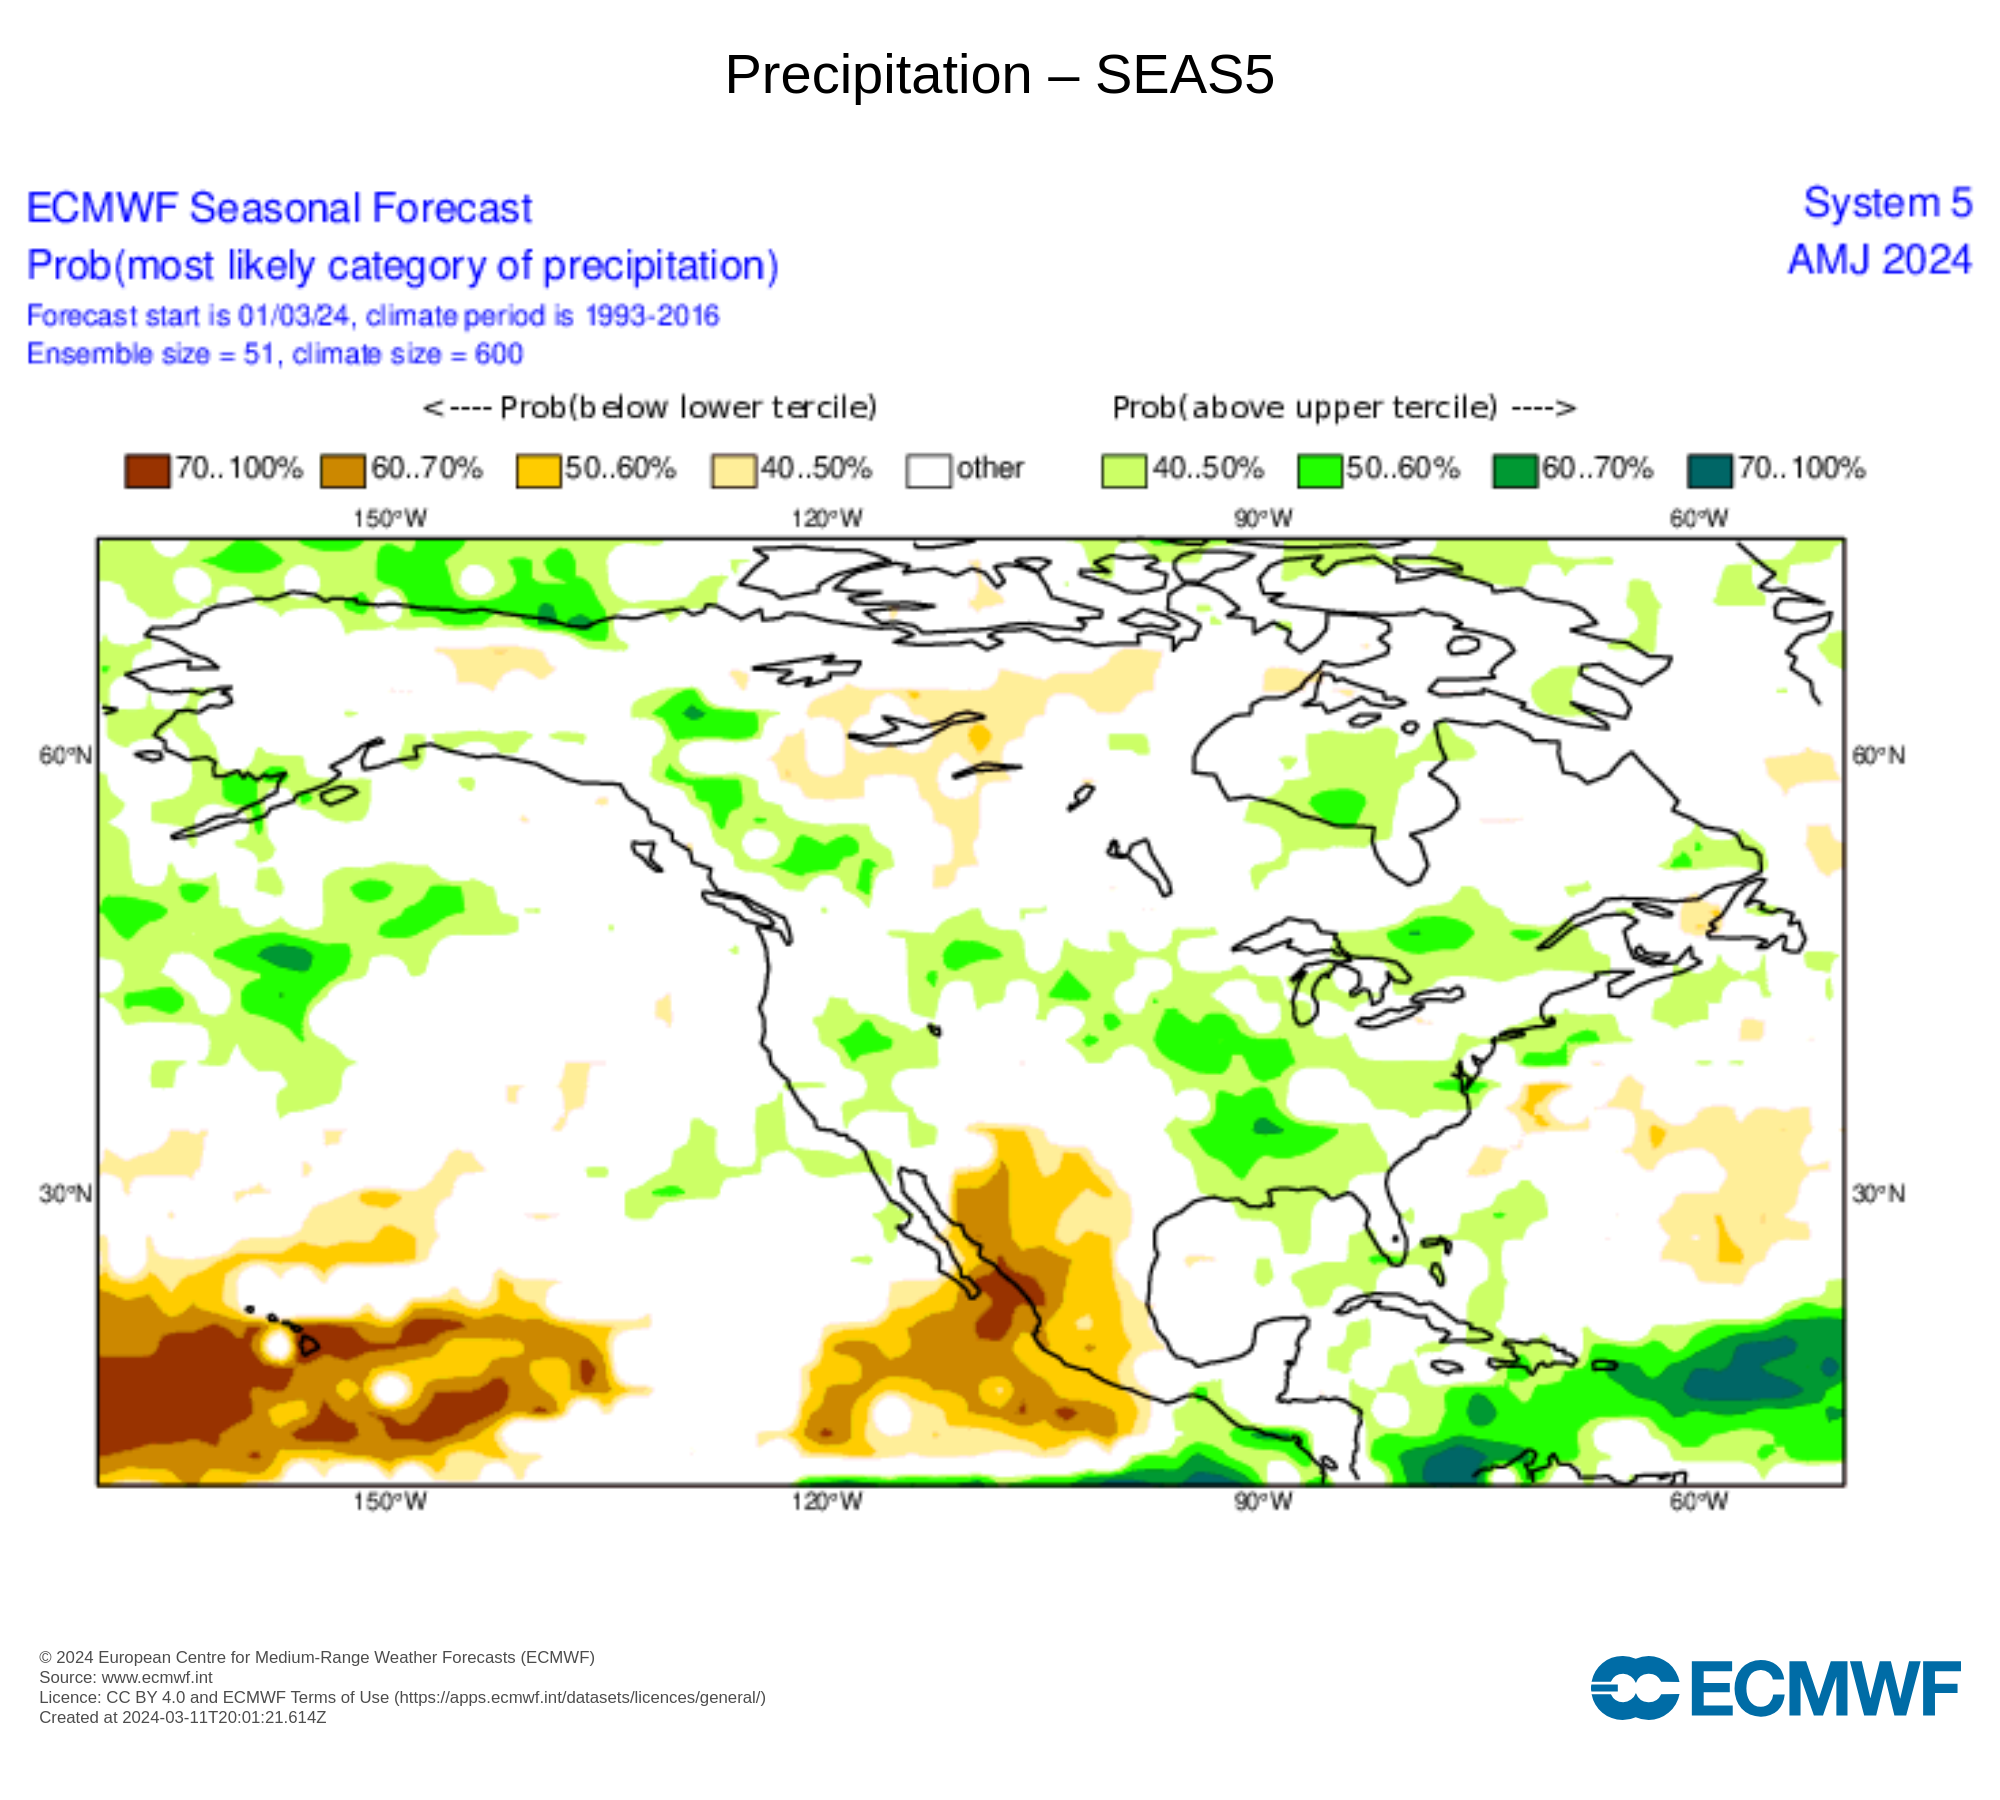 |
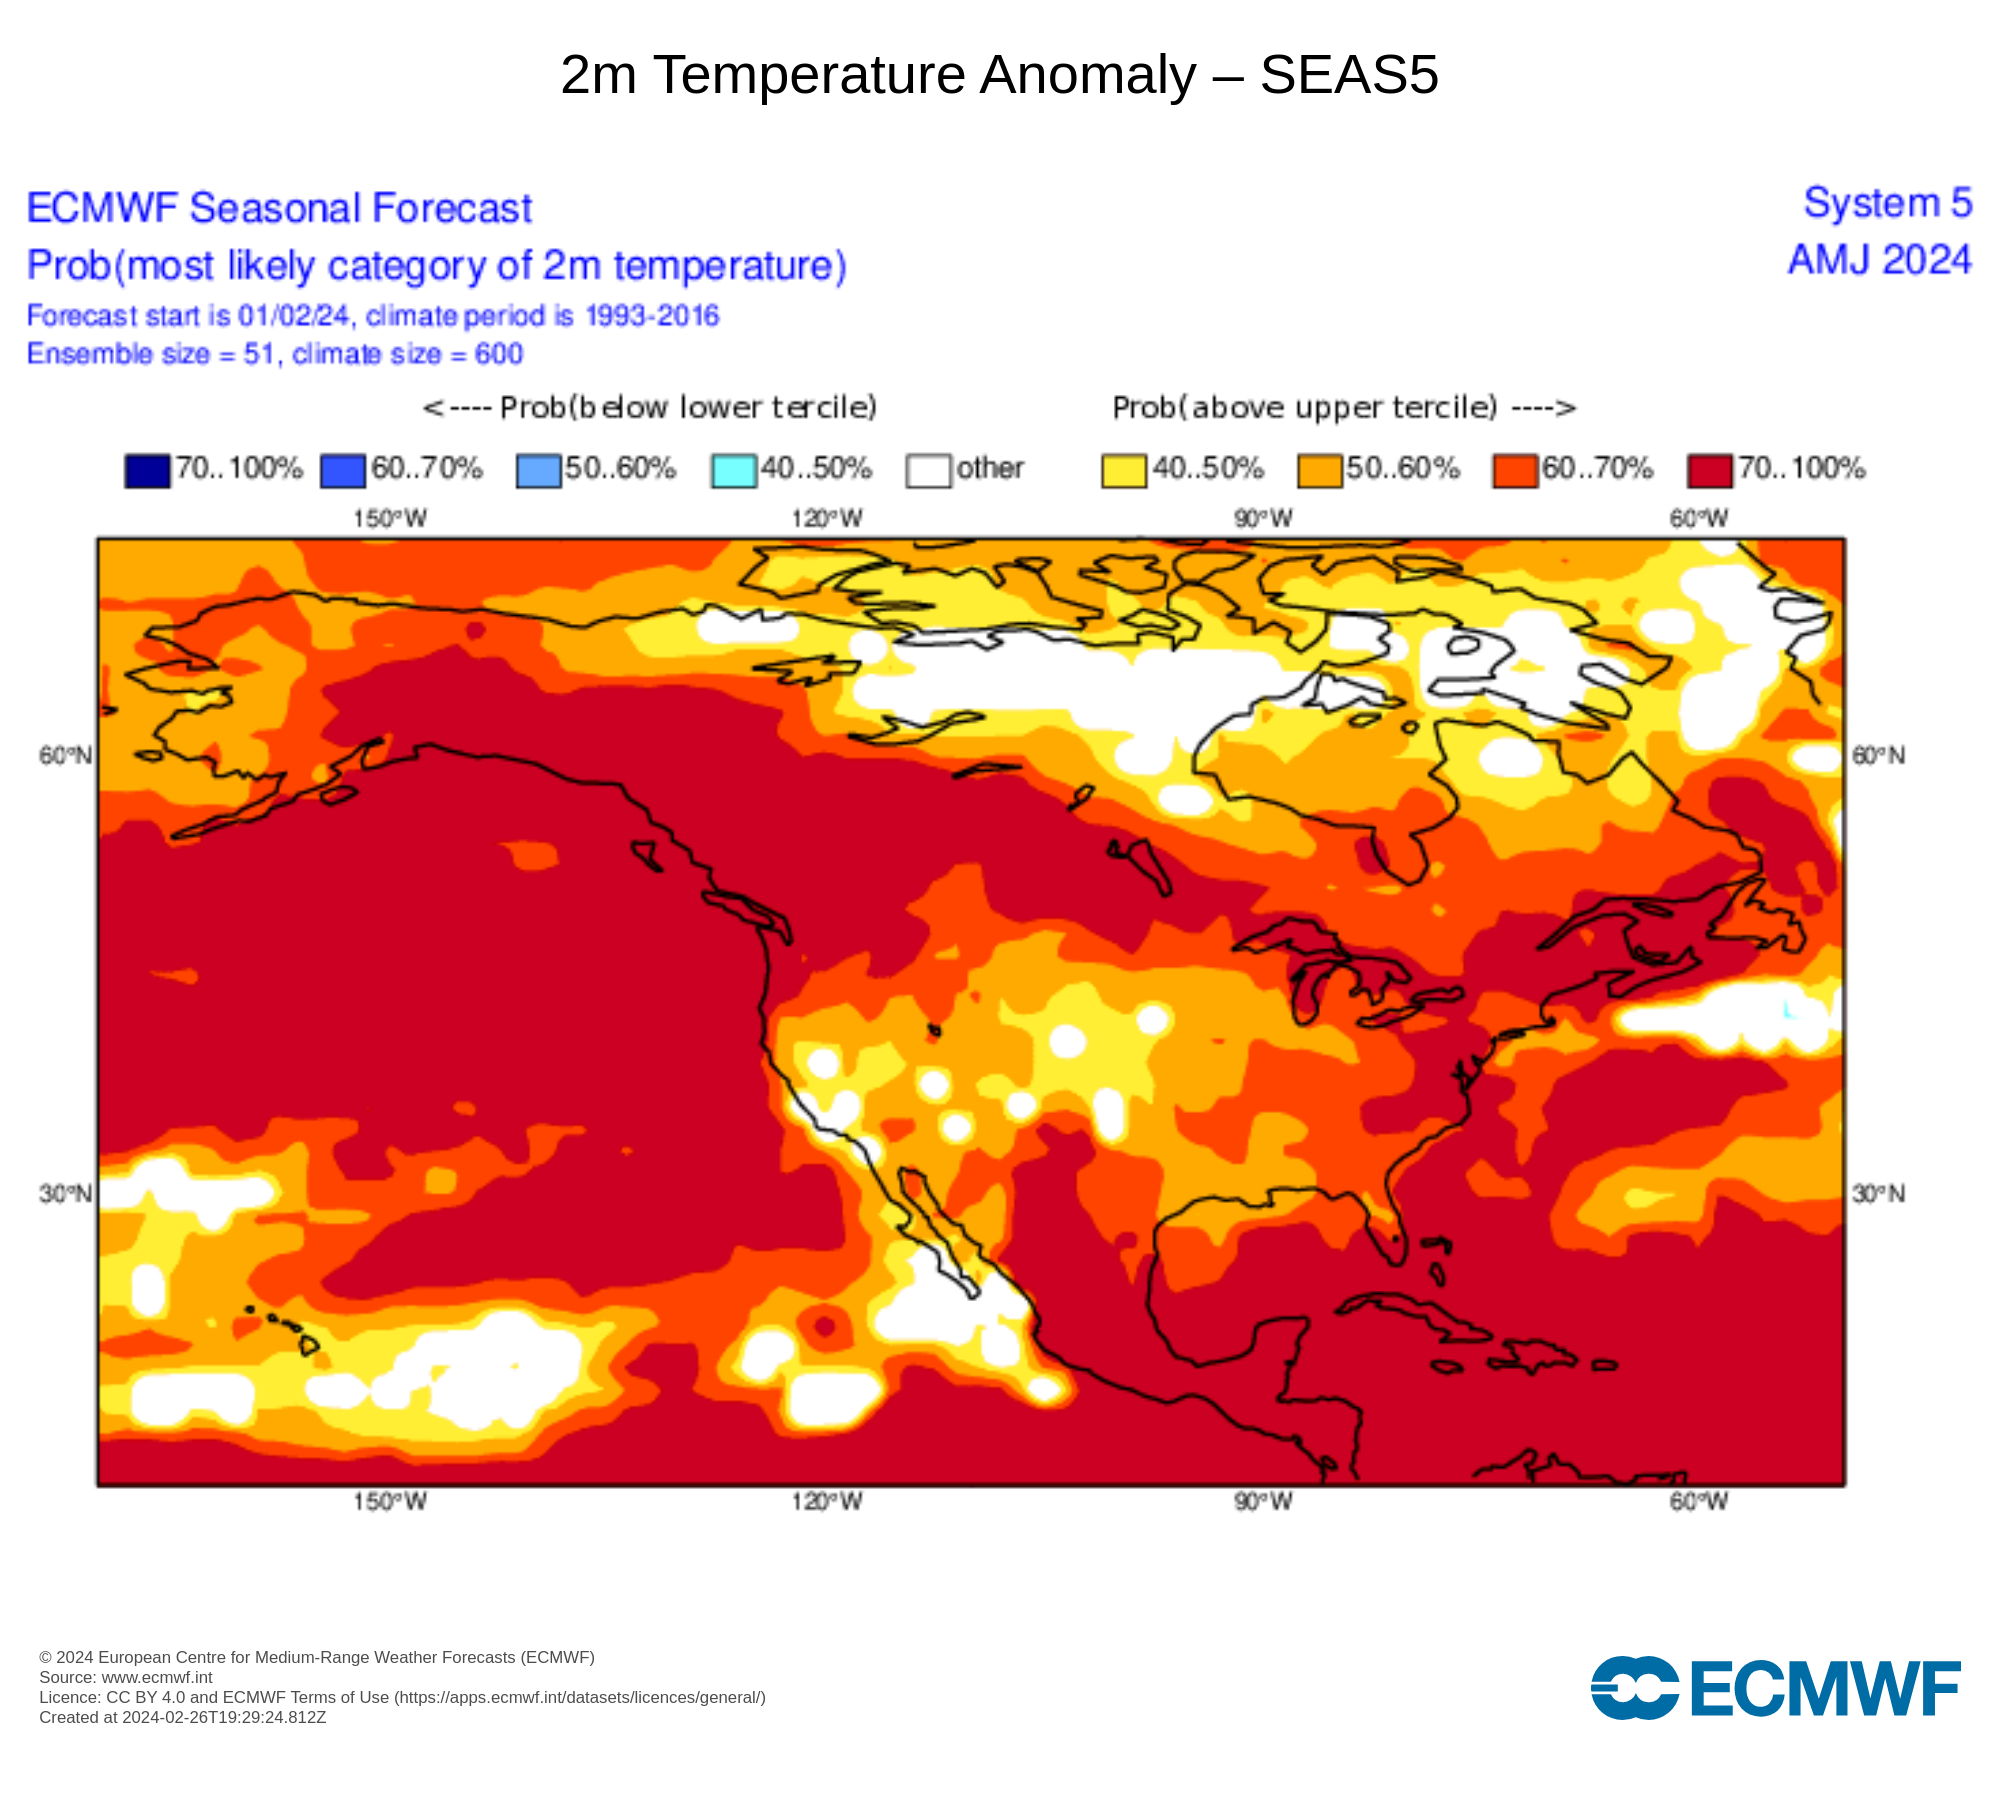
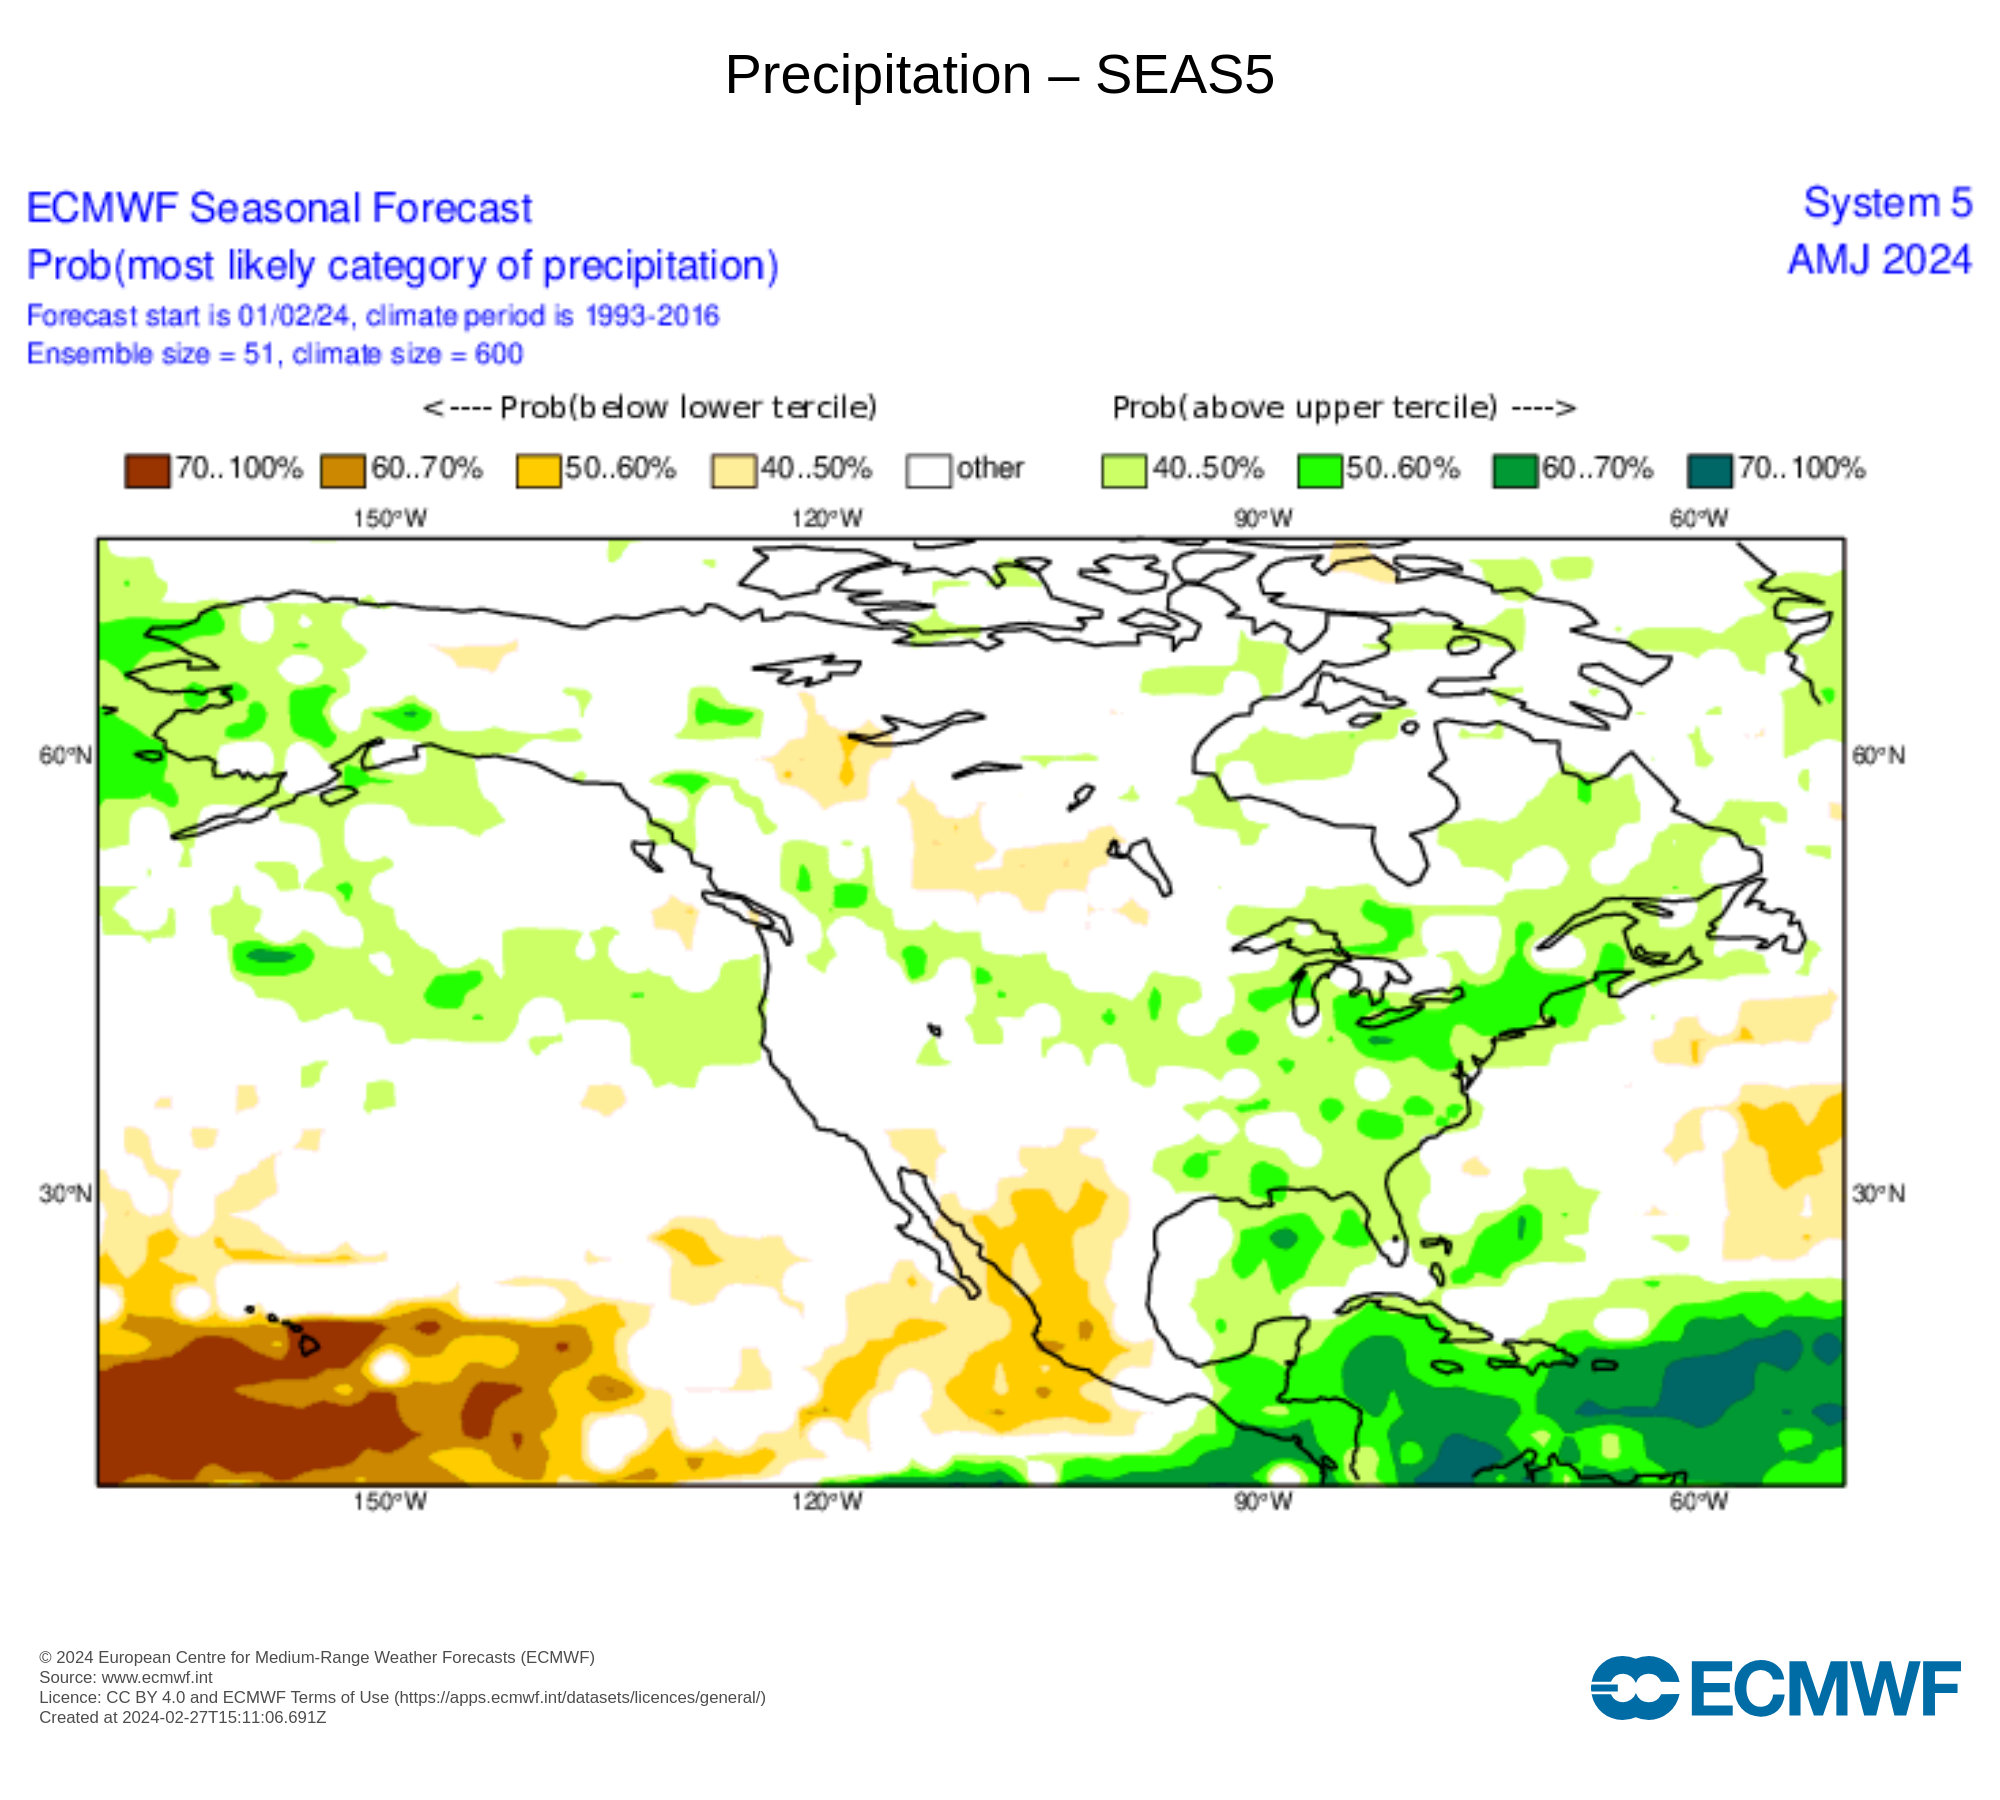
These maps are Seasonal Outlooks from the ECMWF models for April-May-June showing the Probable Temperature and Precipitation Trend. |
  |
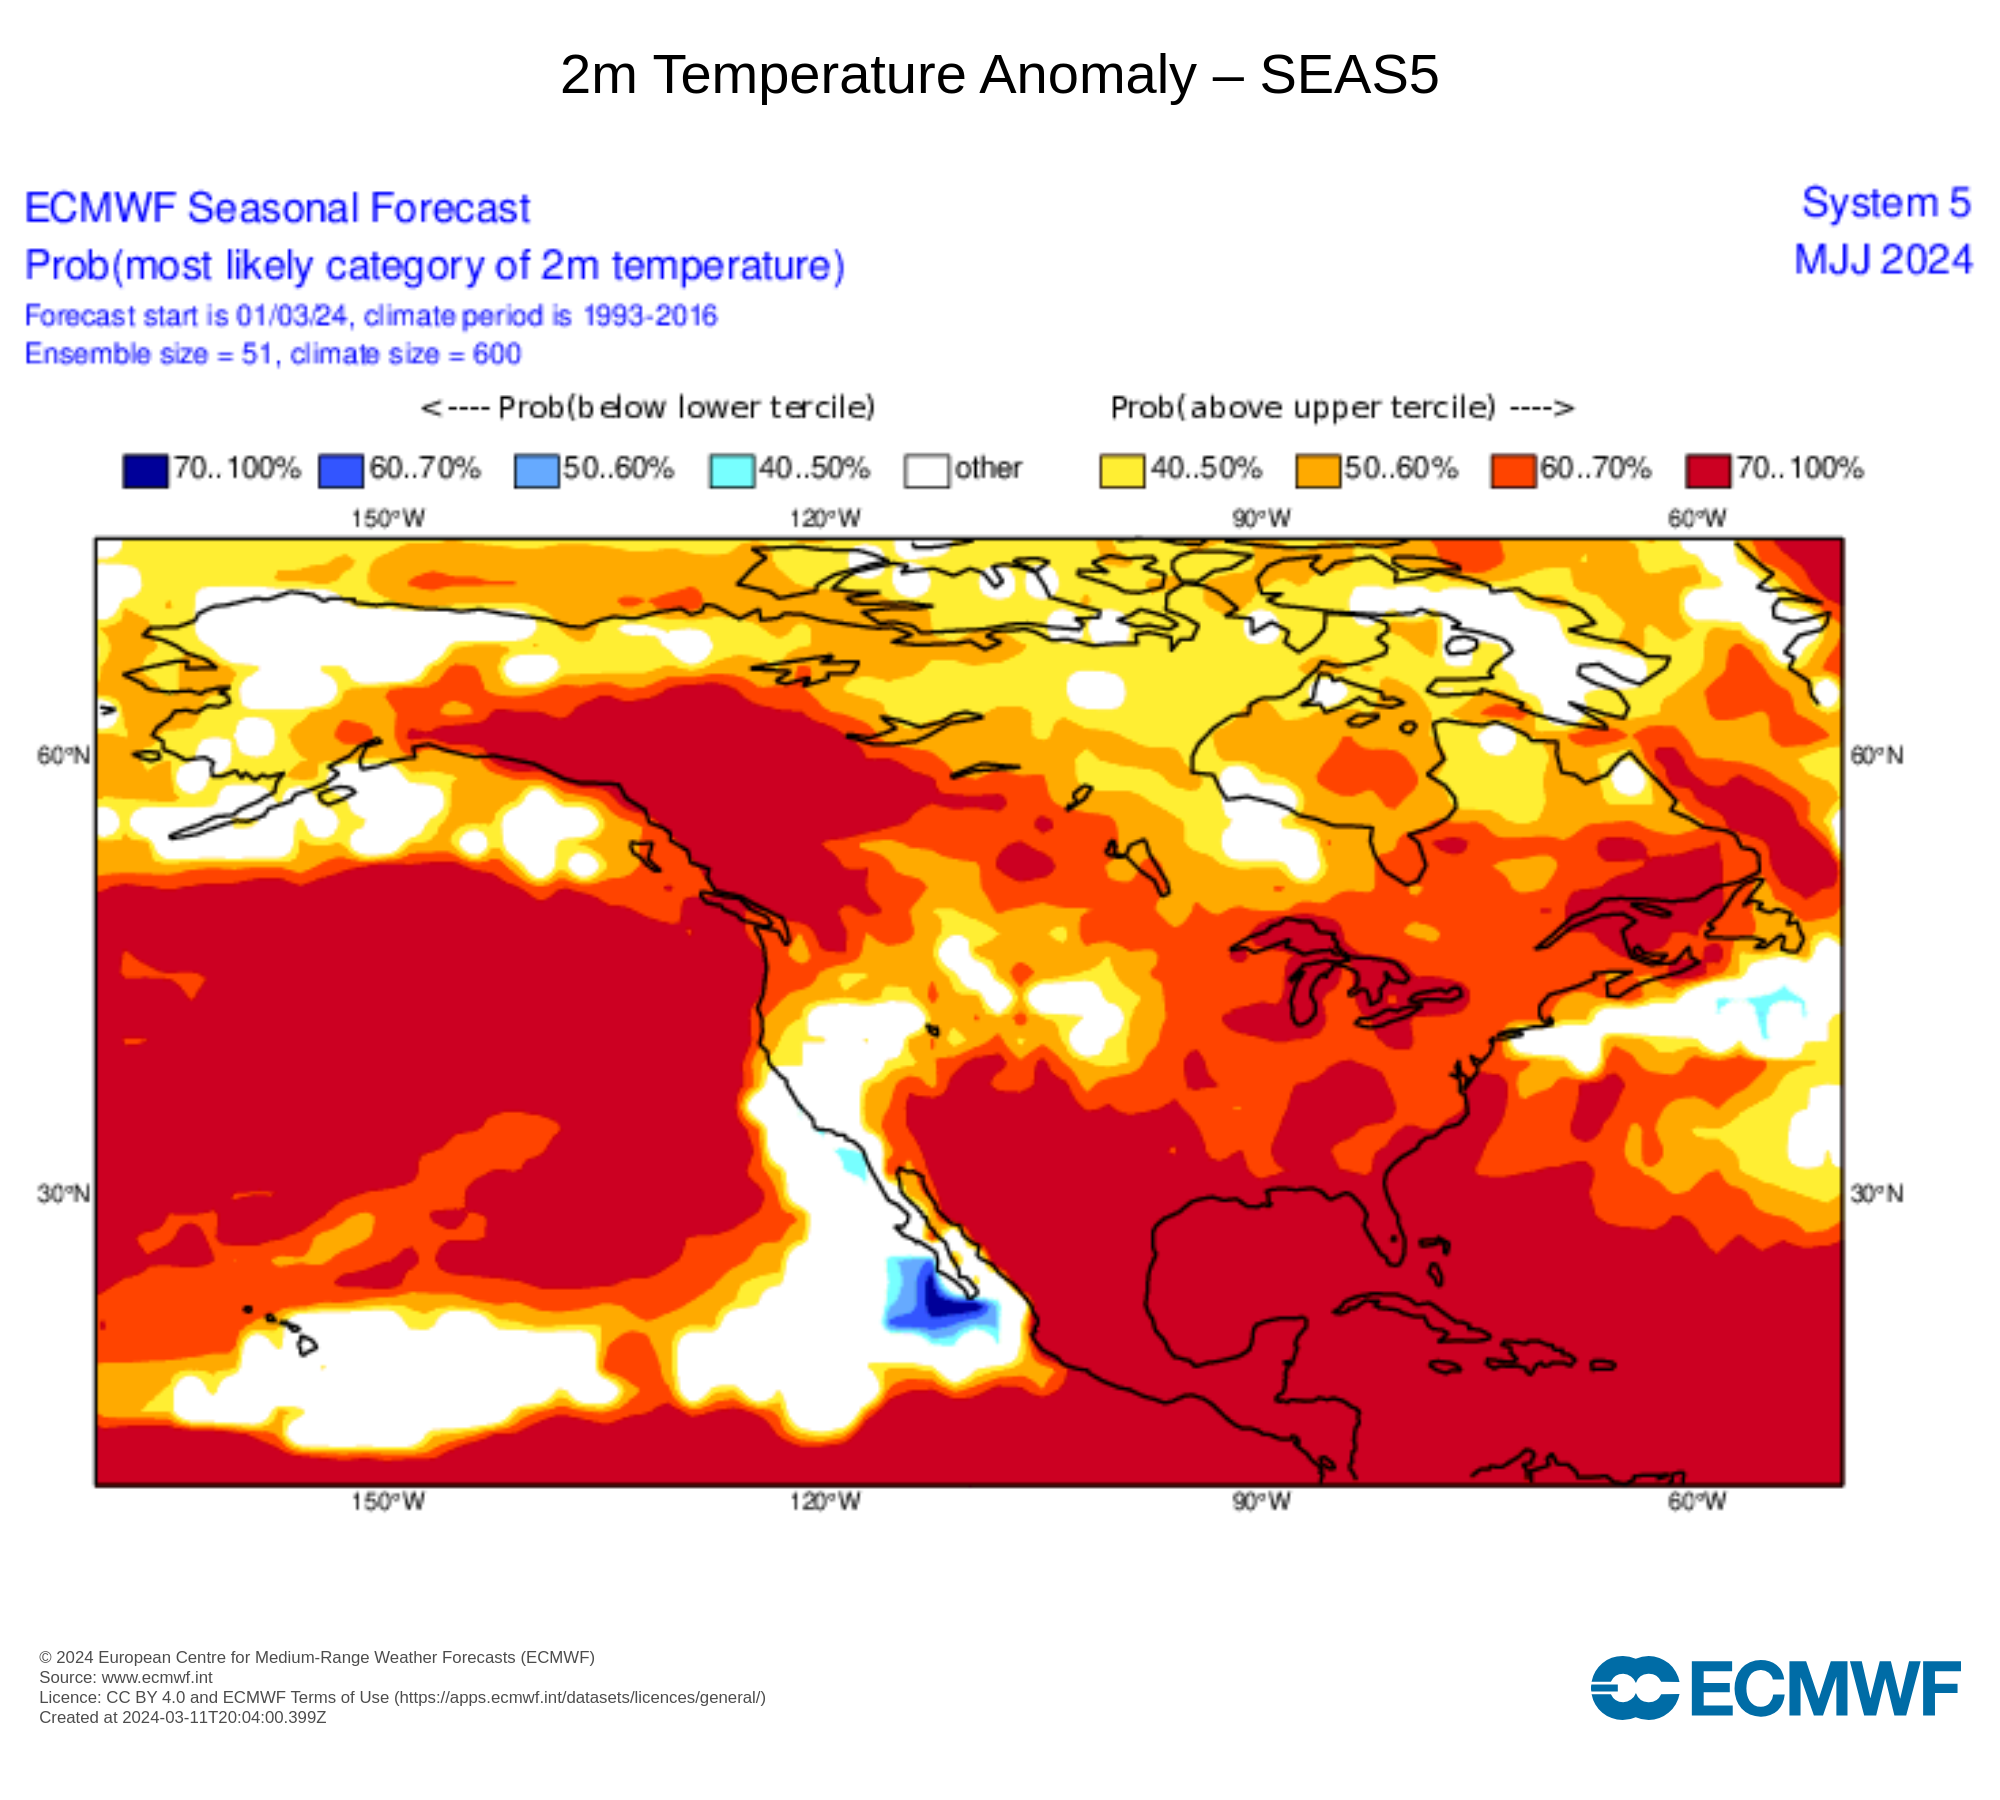 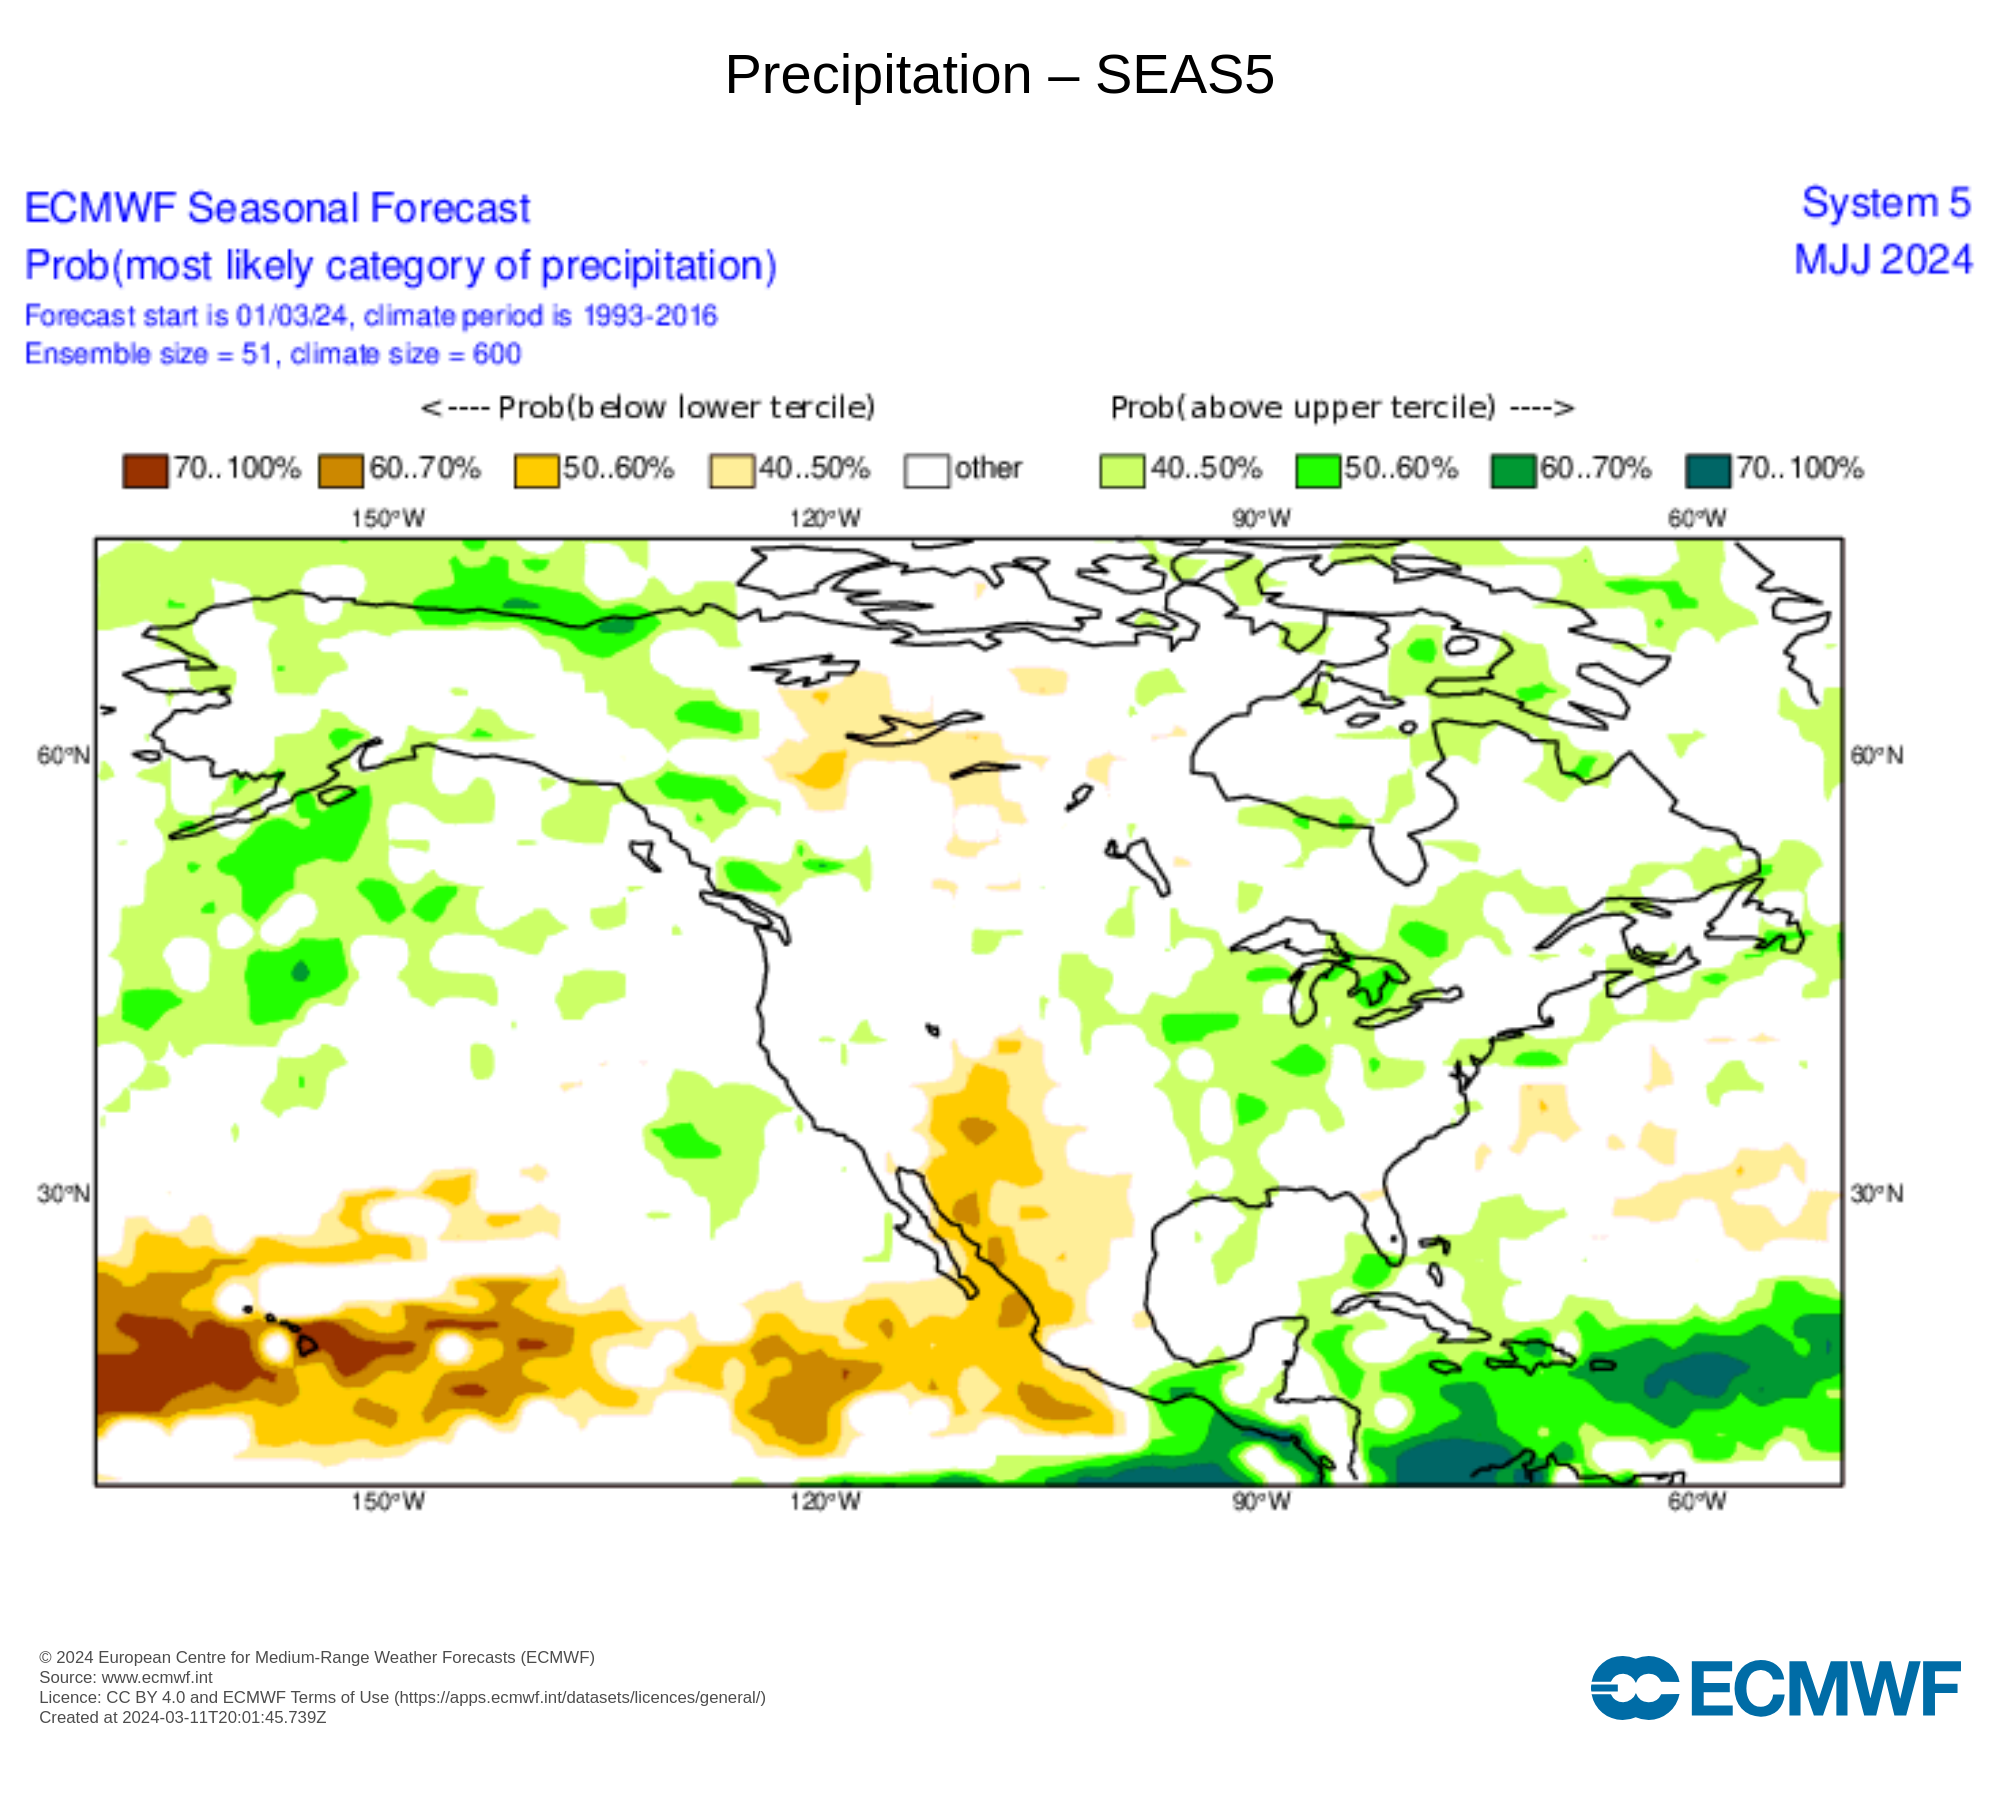 |
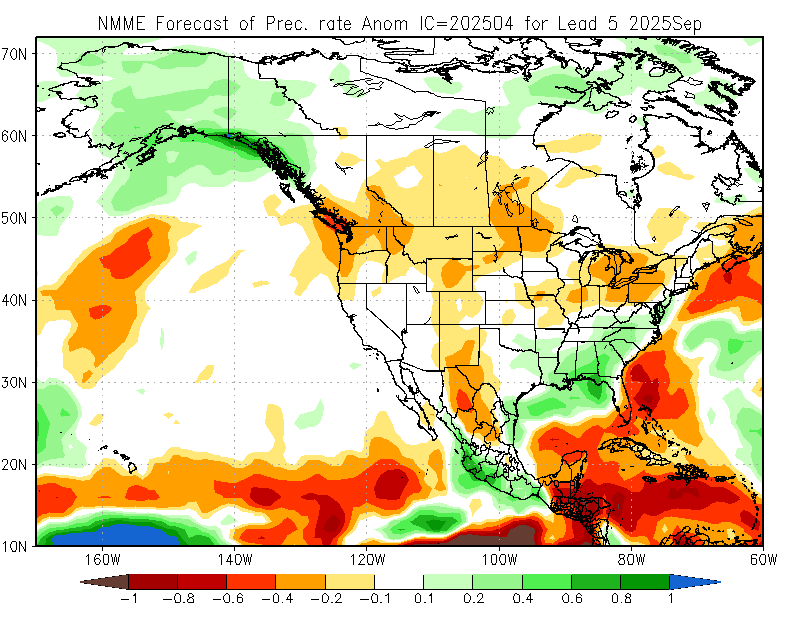
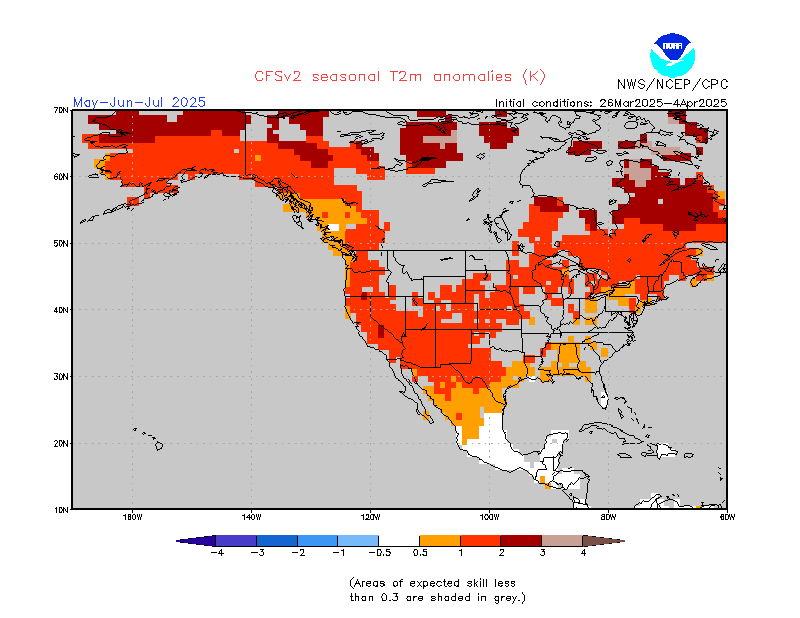
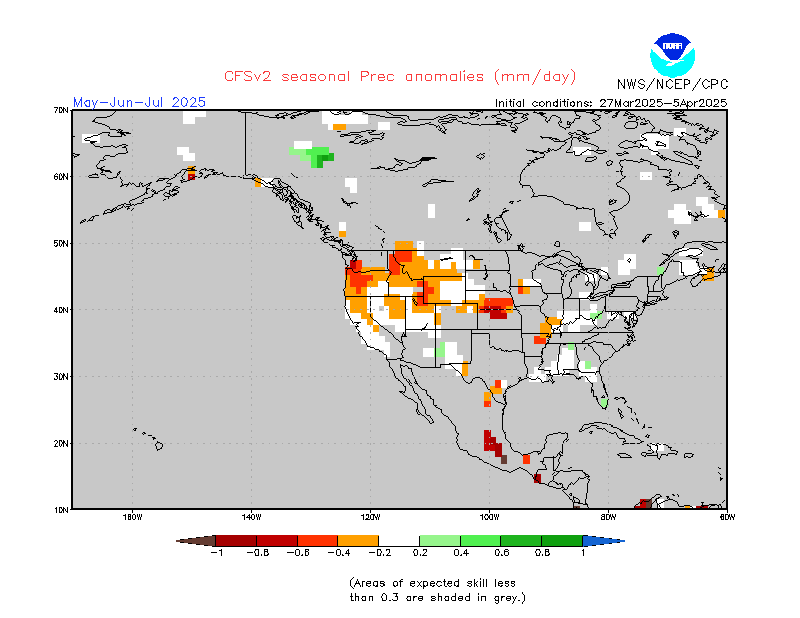
These maps are Seasonal Outlooks from the ECMWF models for May-June_July showing the Probable Temperature and Precipitation Trend. |
  |
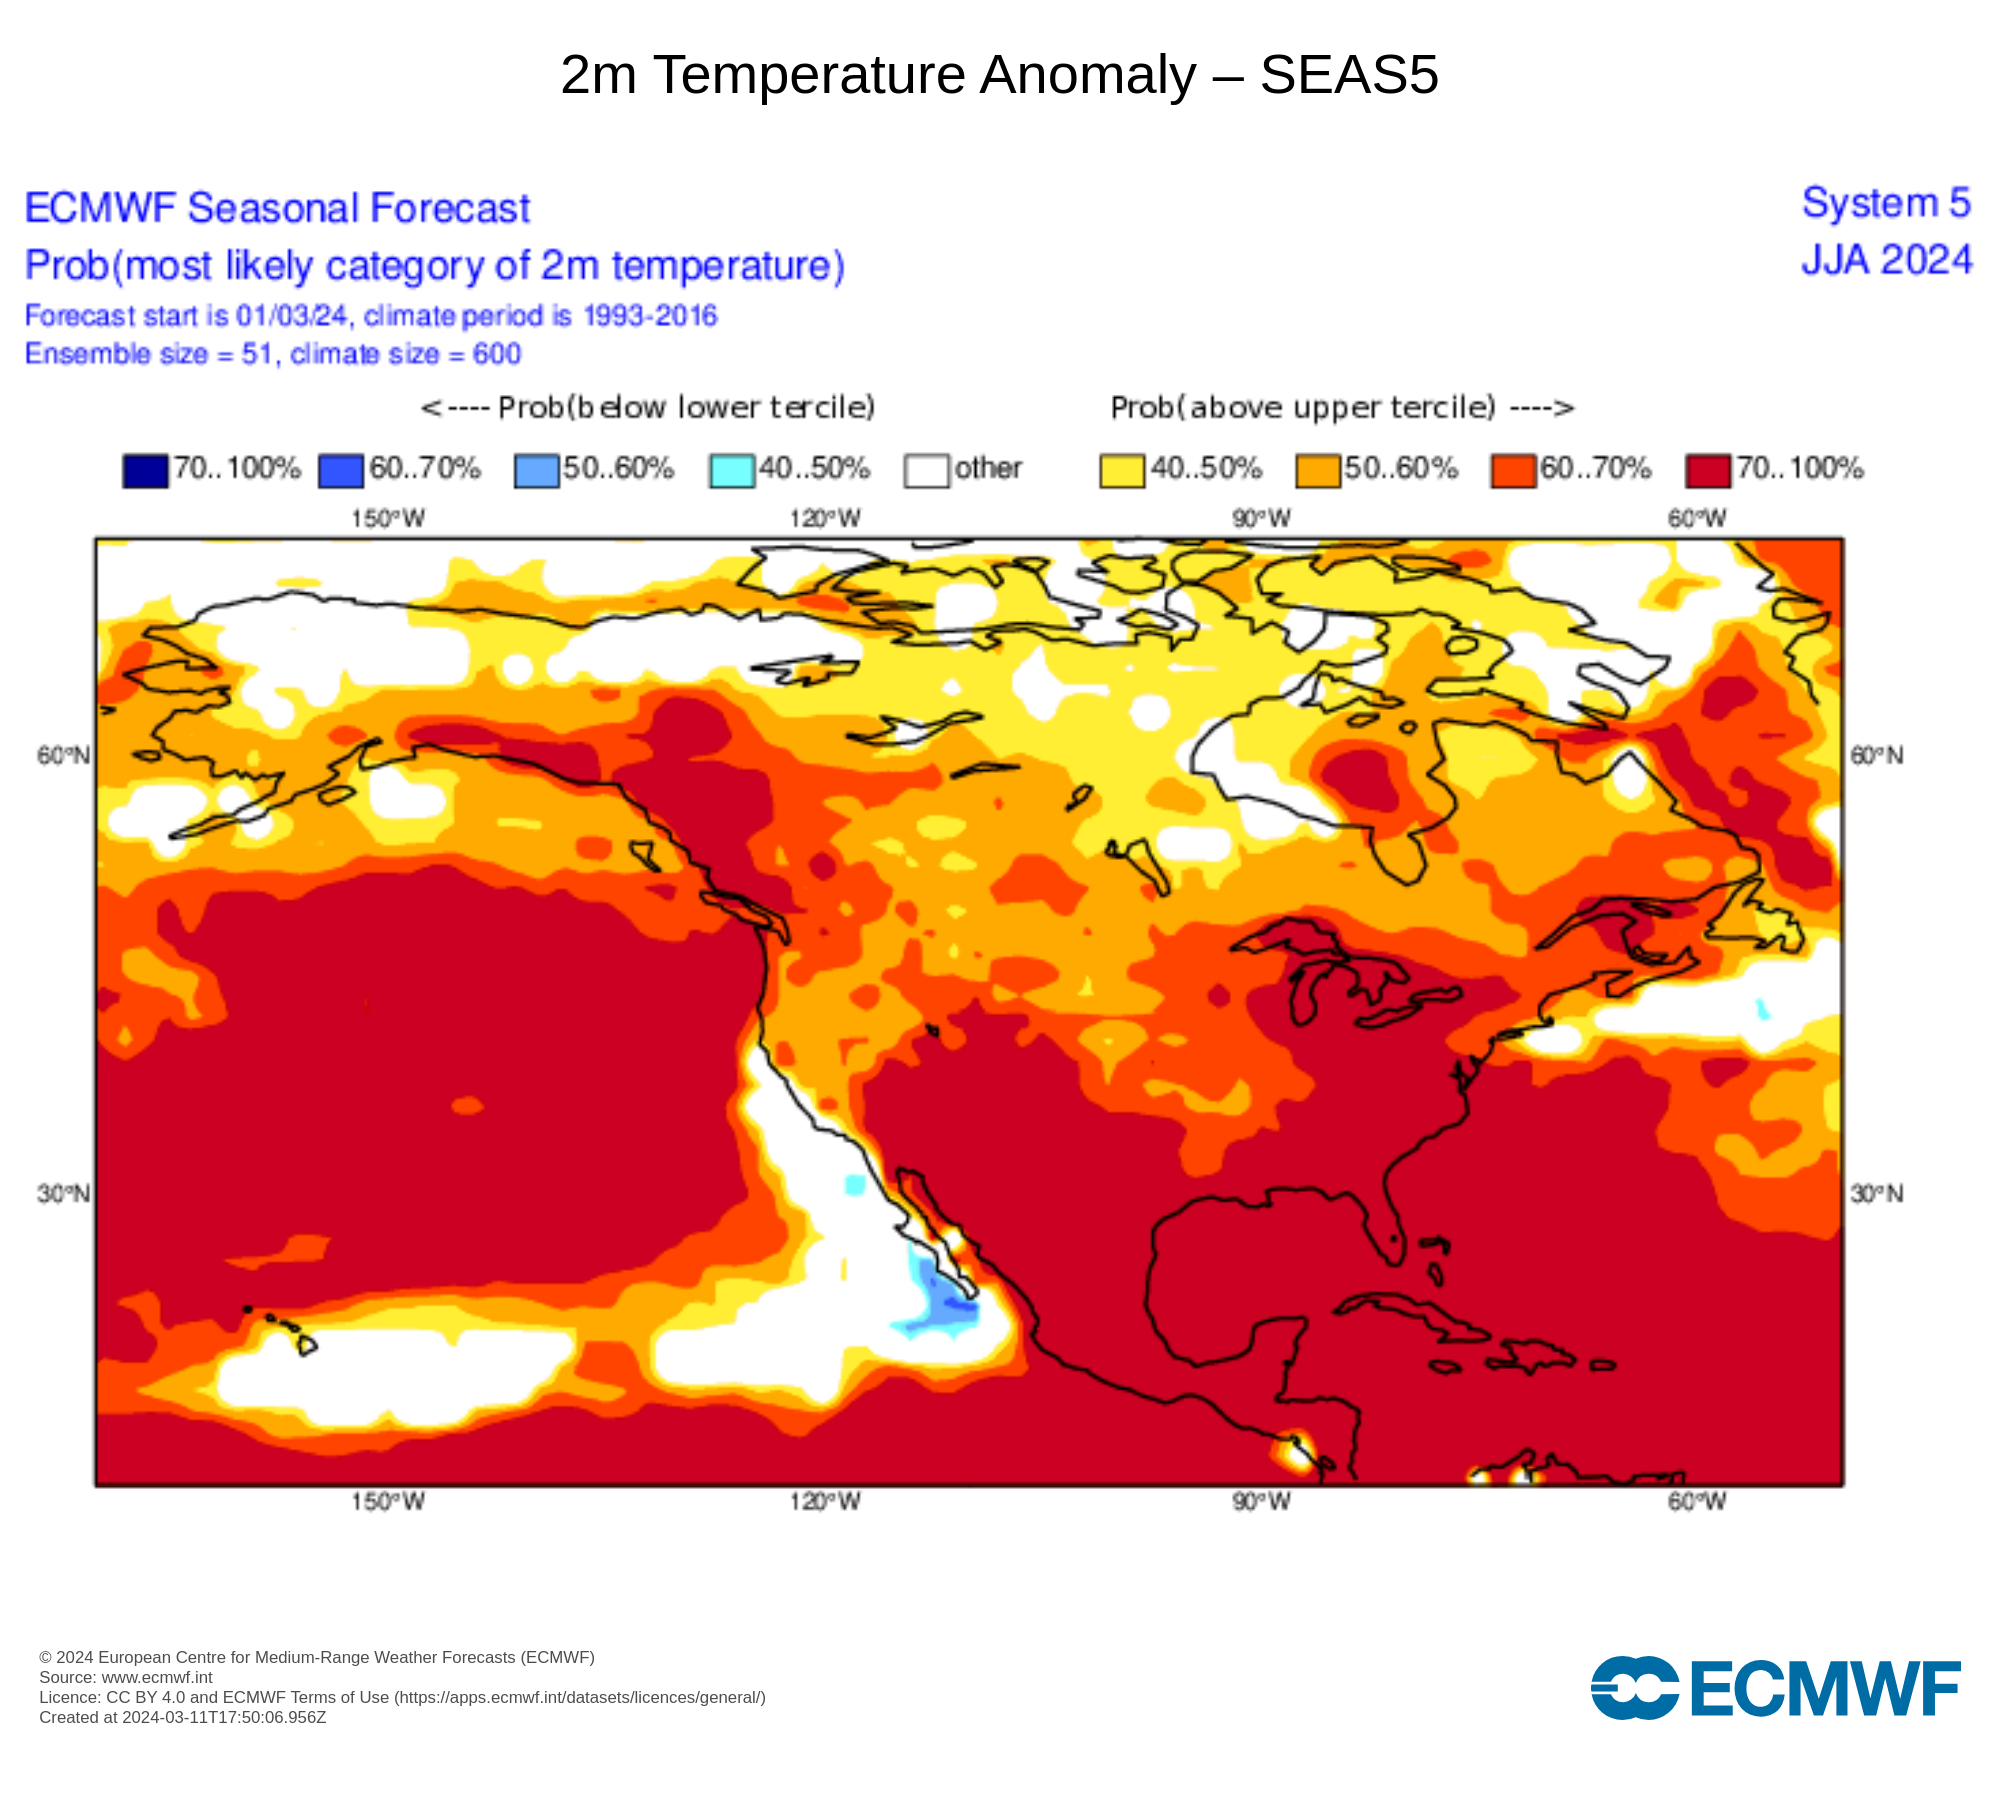 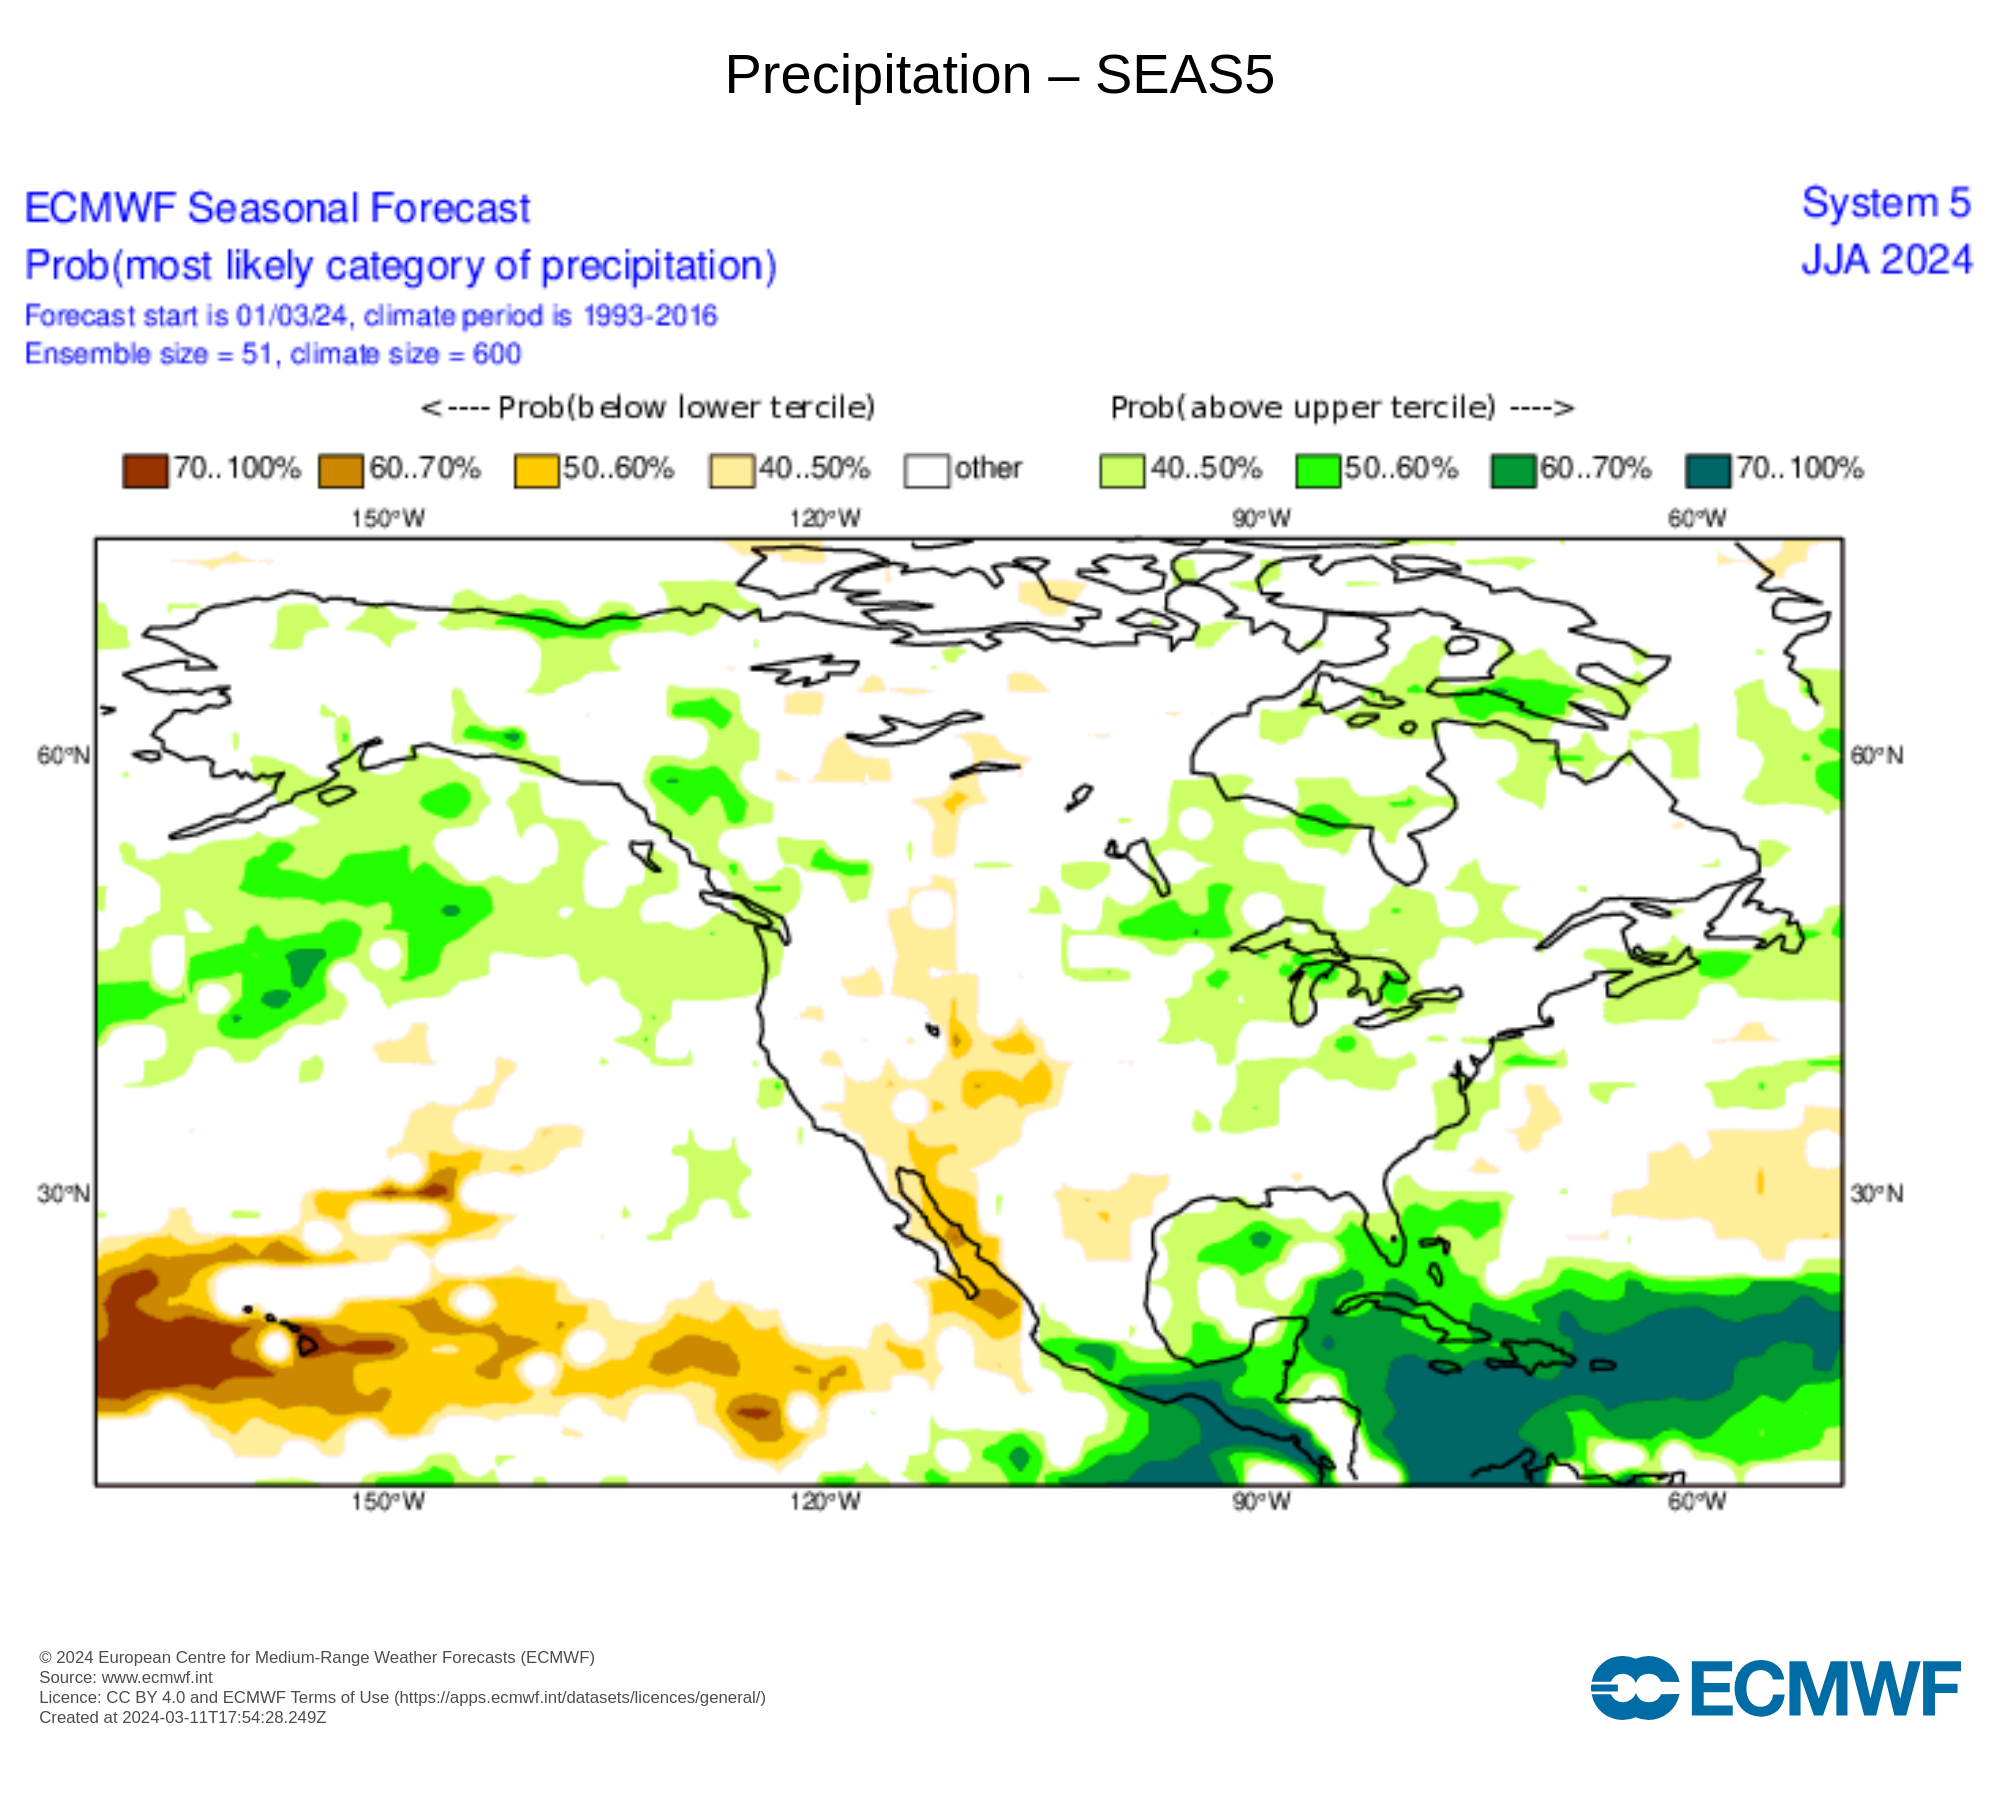 |
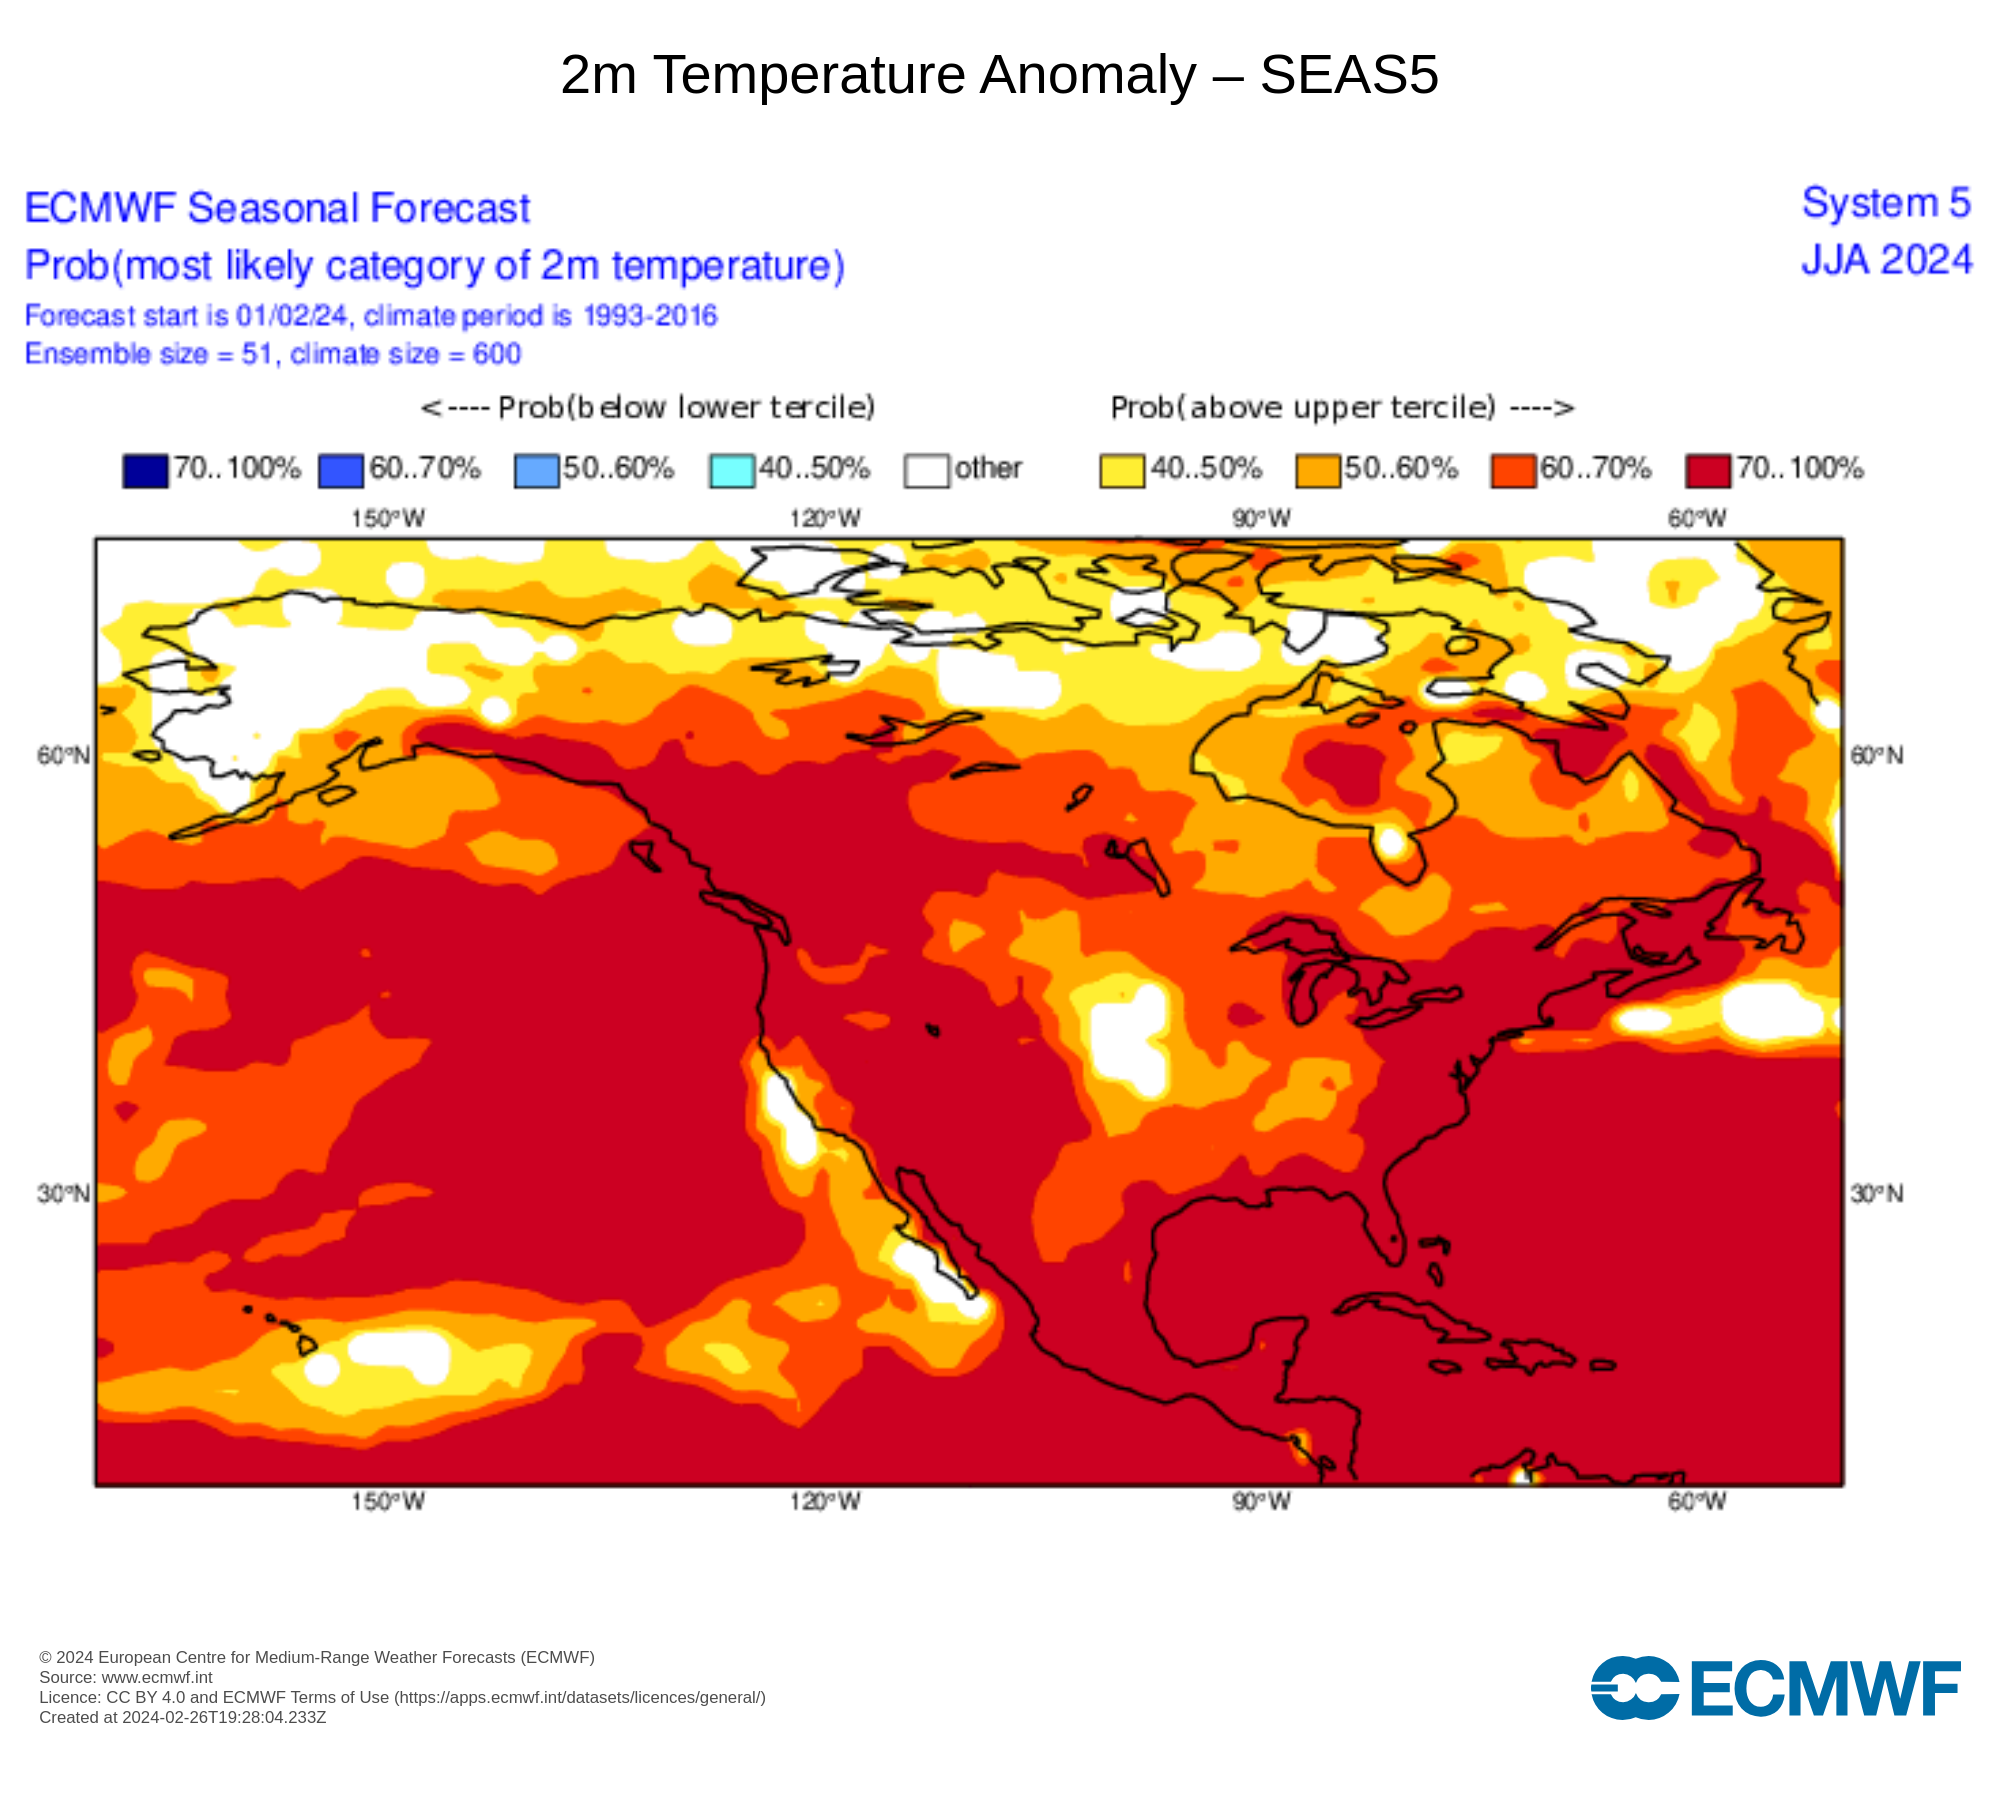
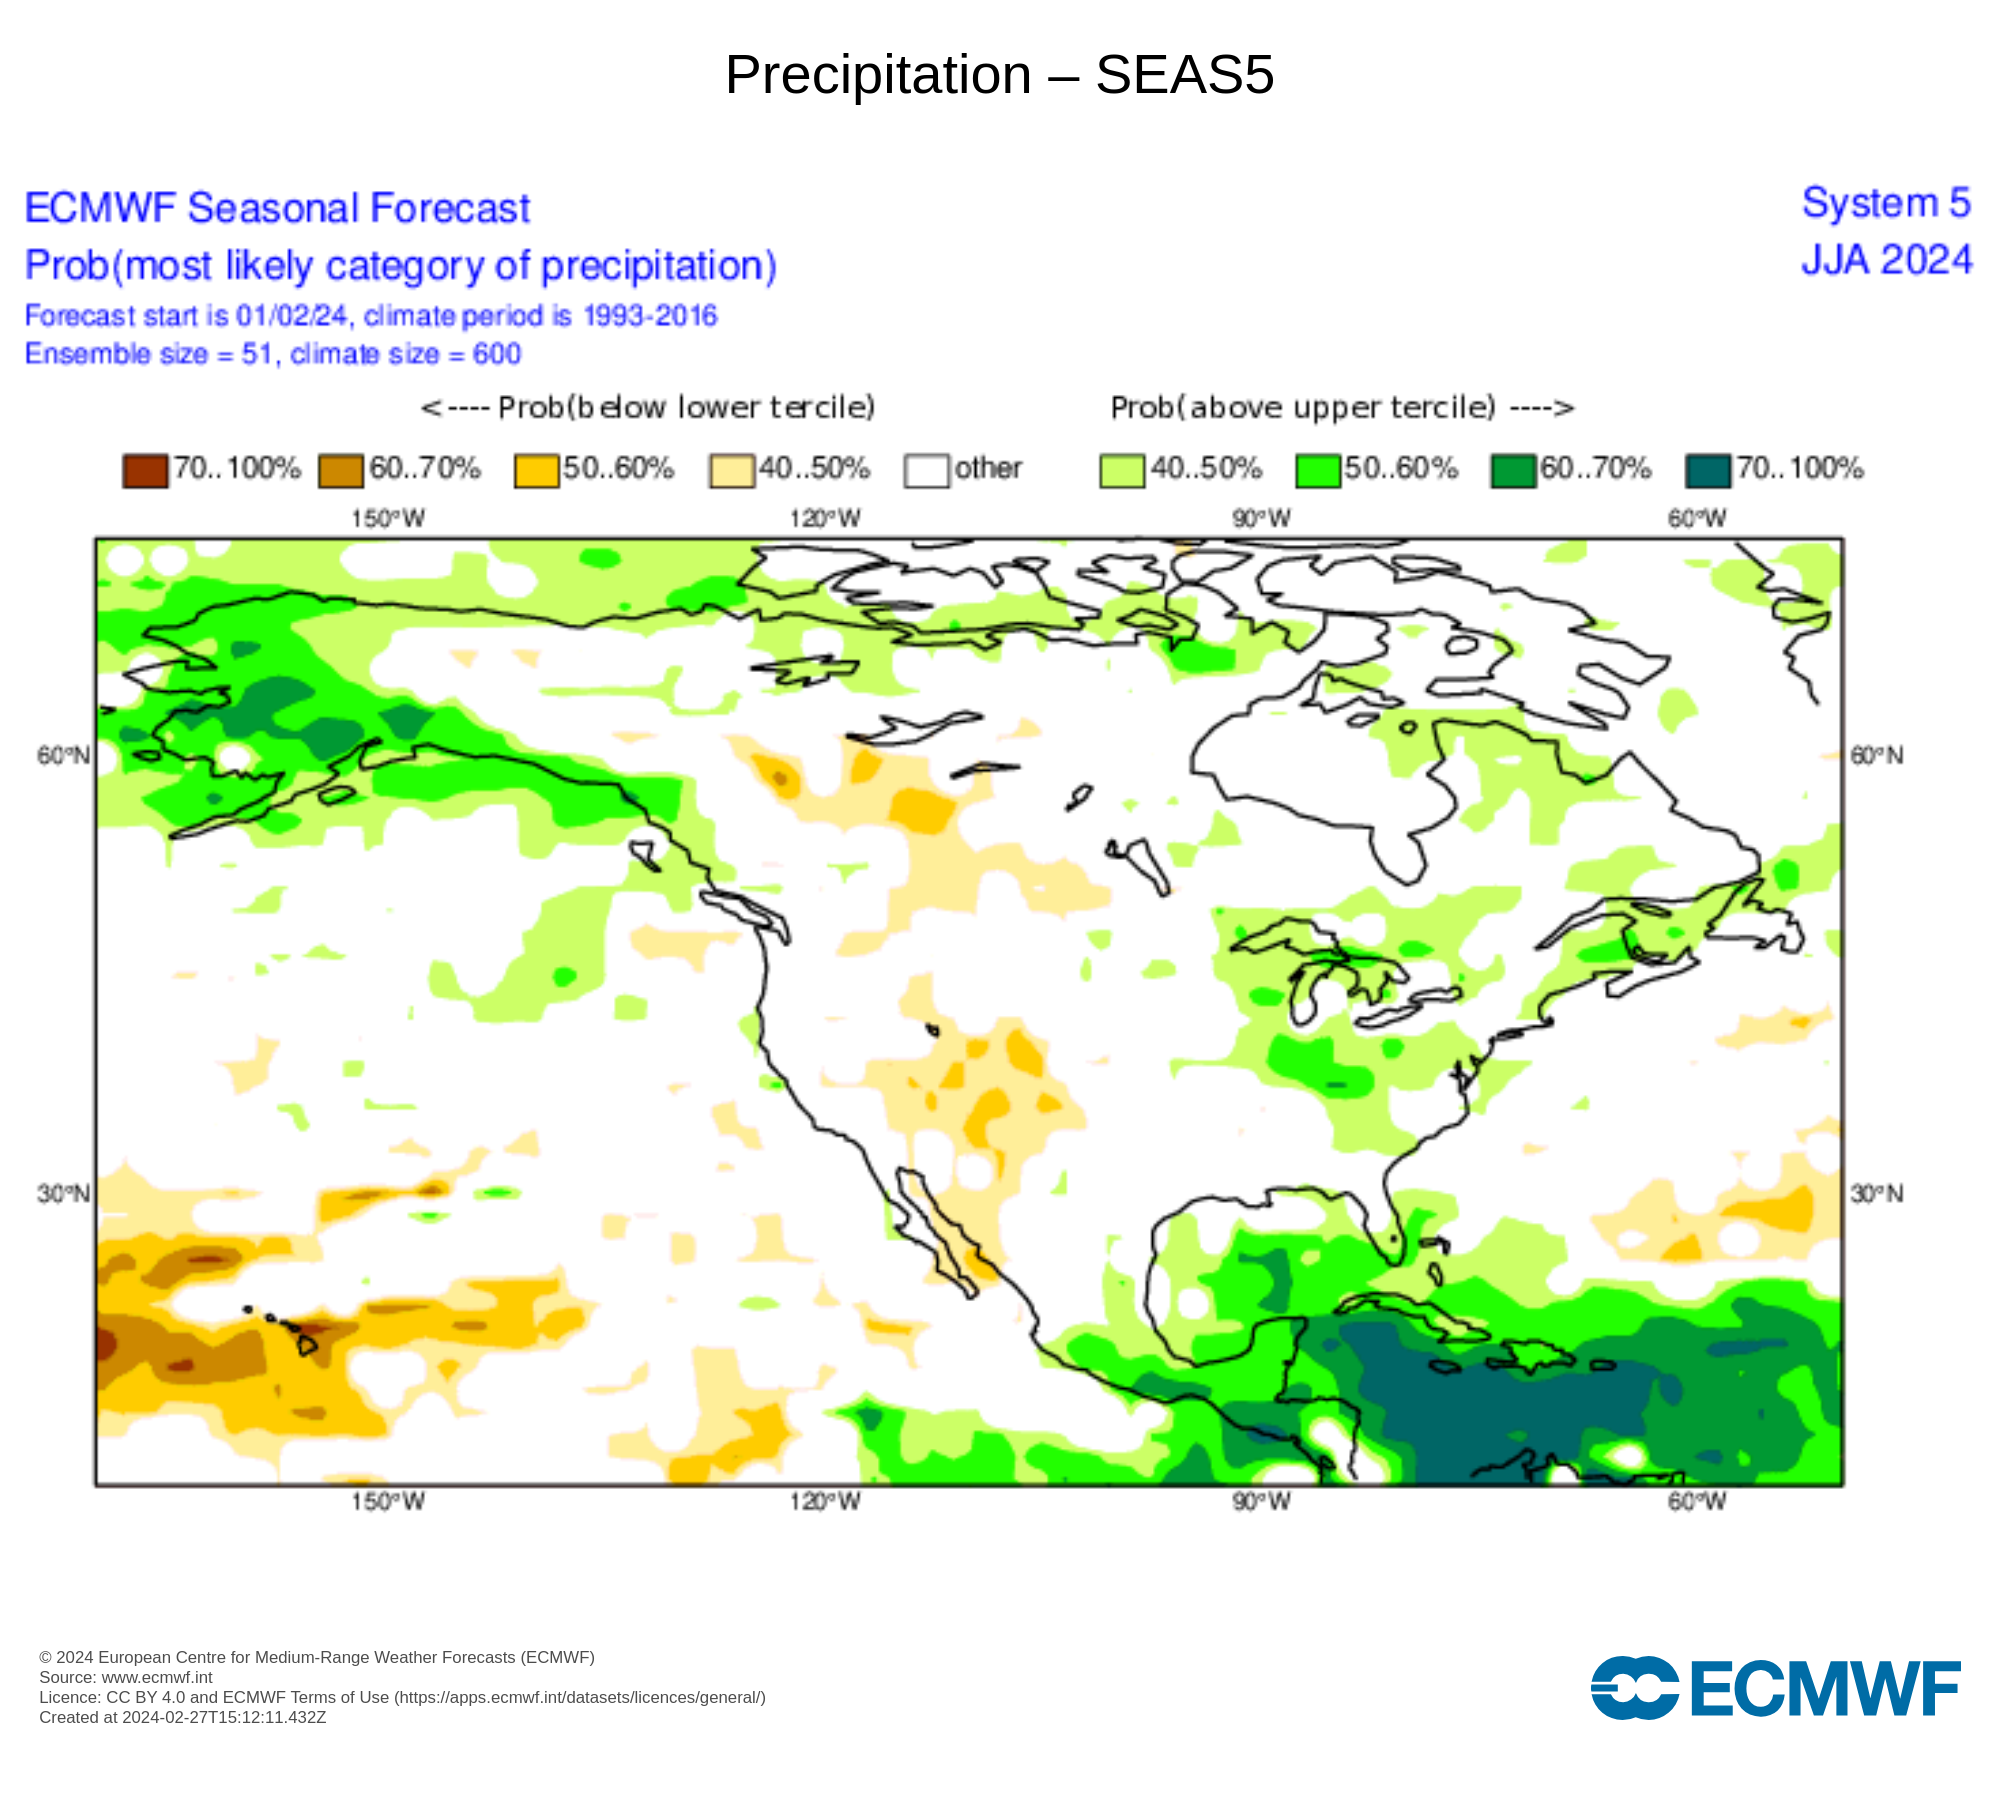
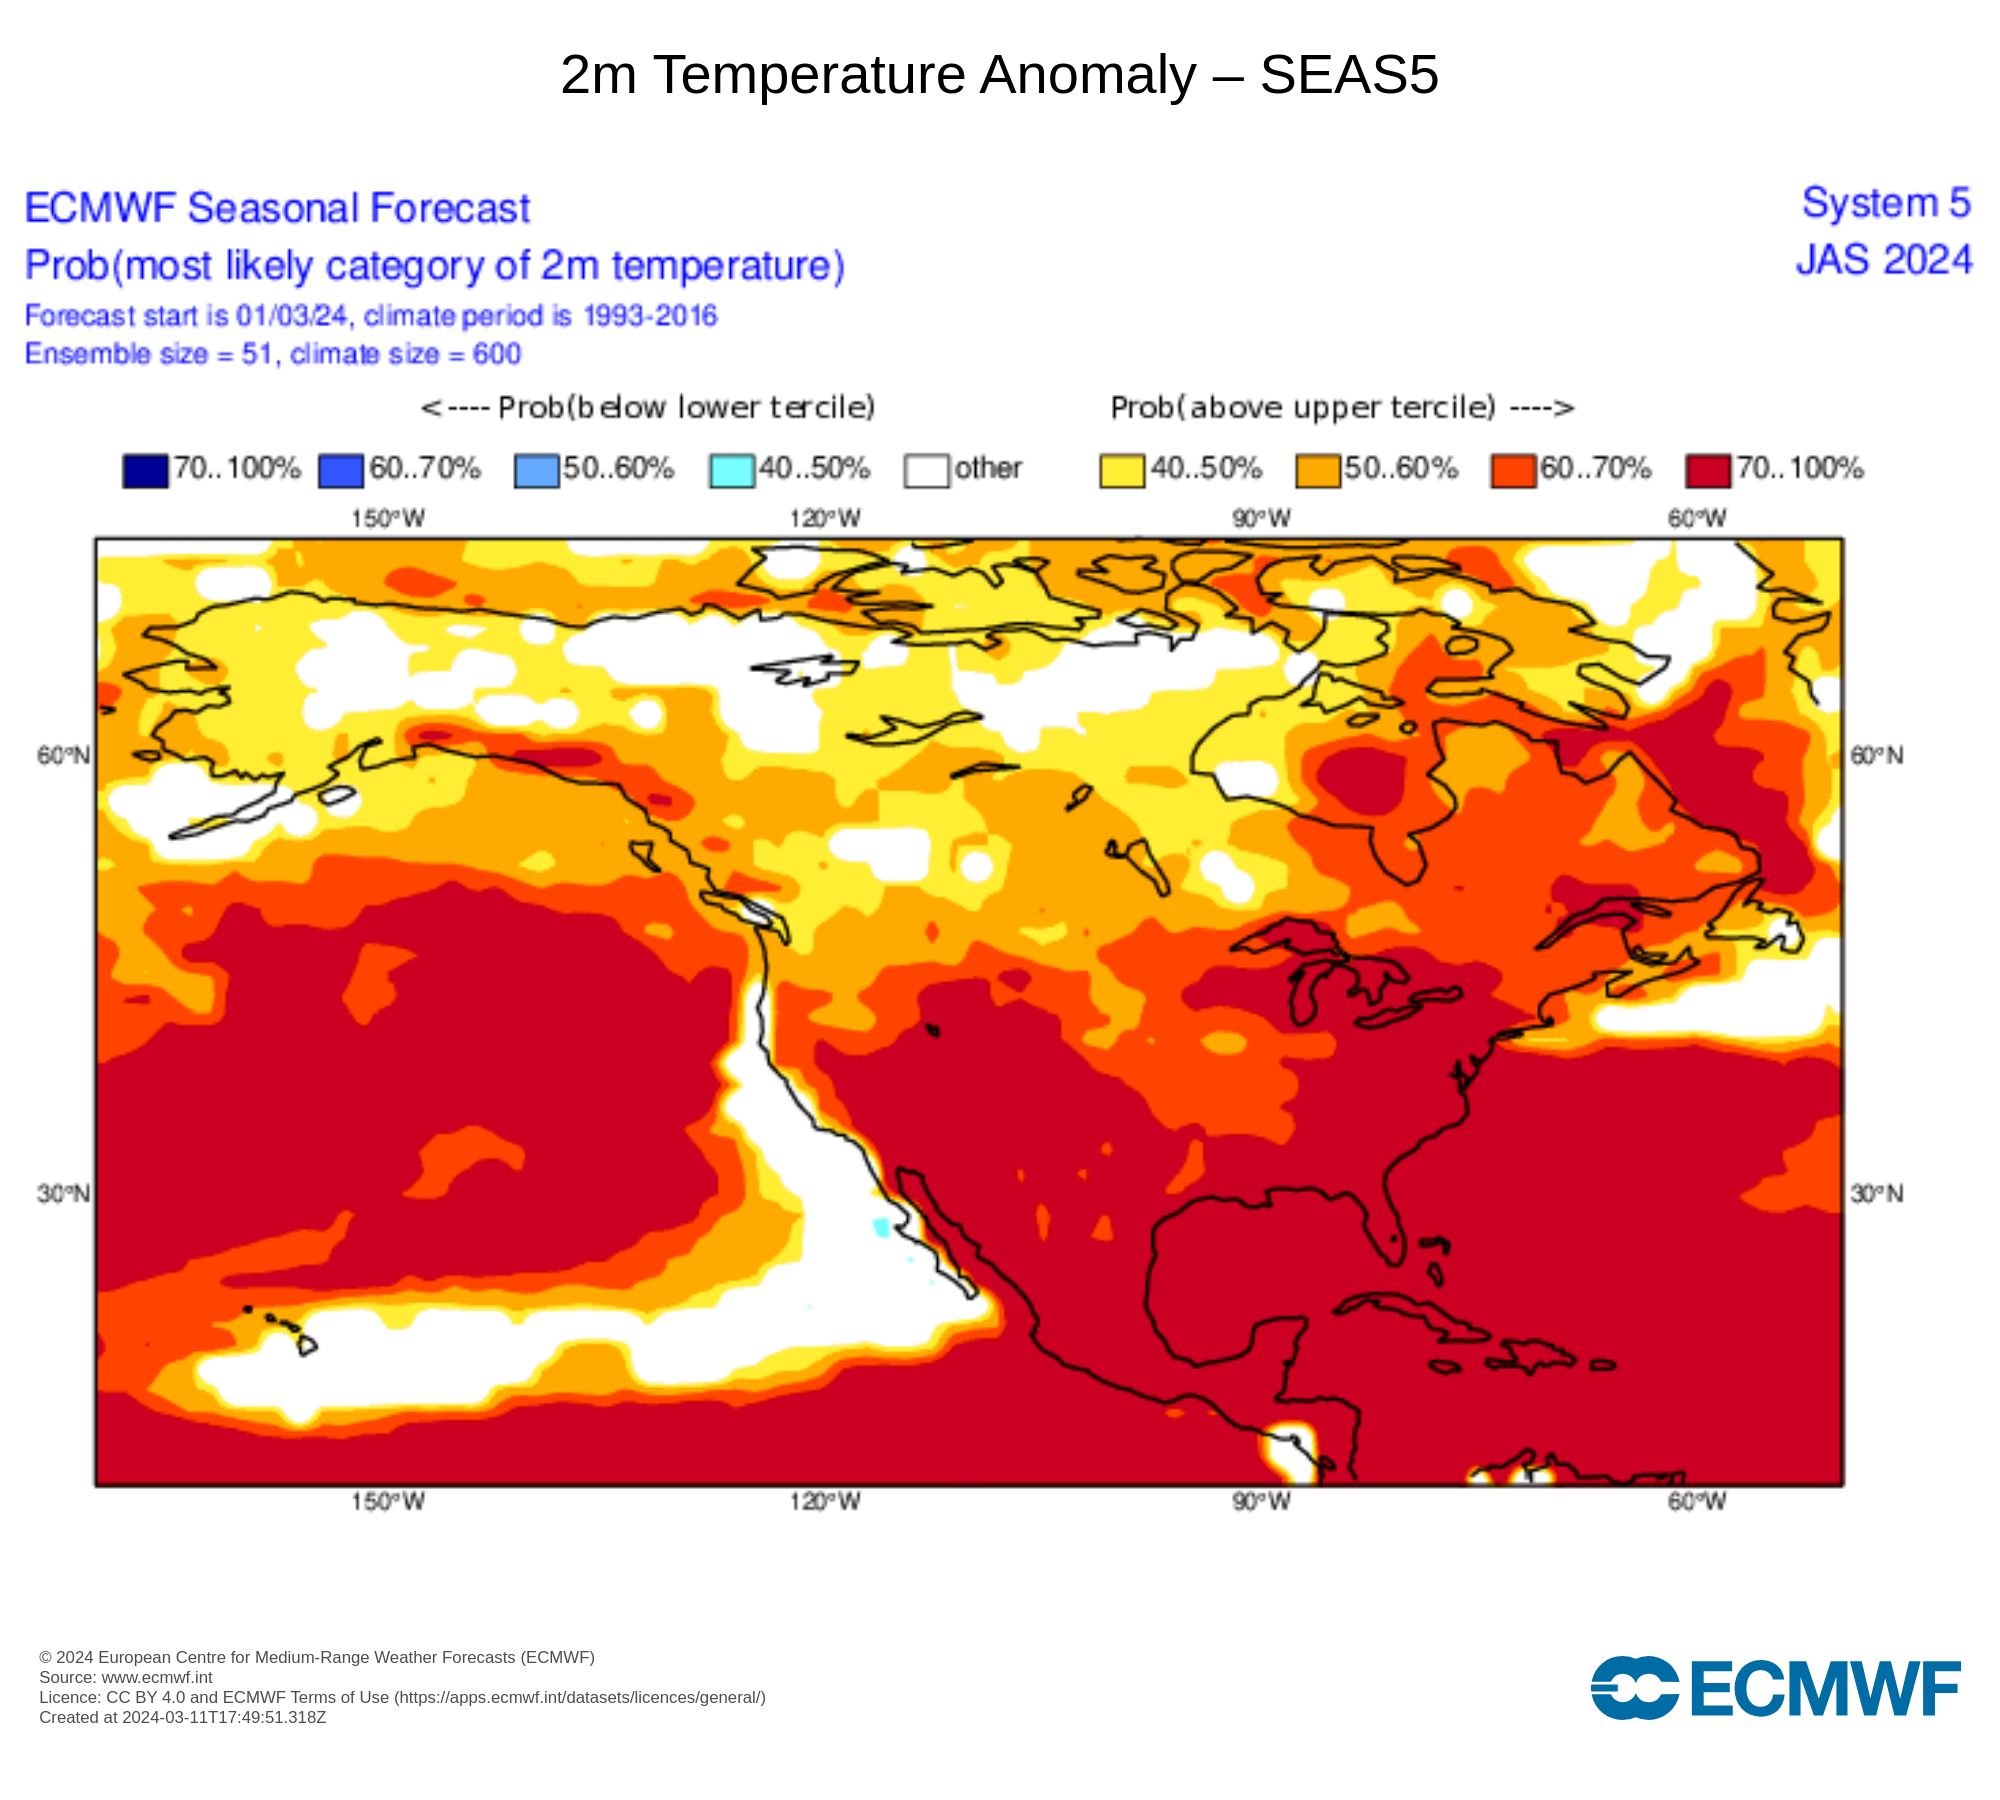
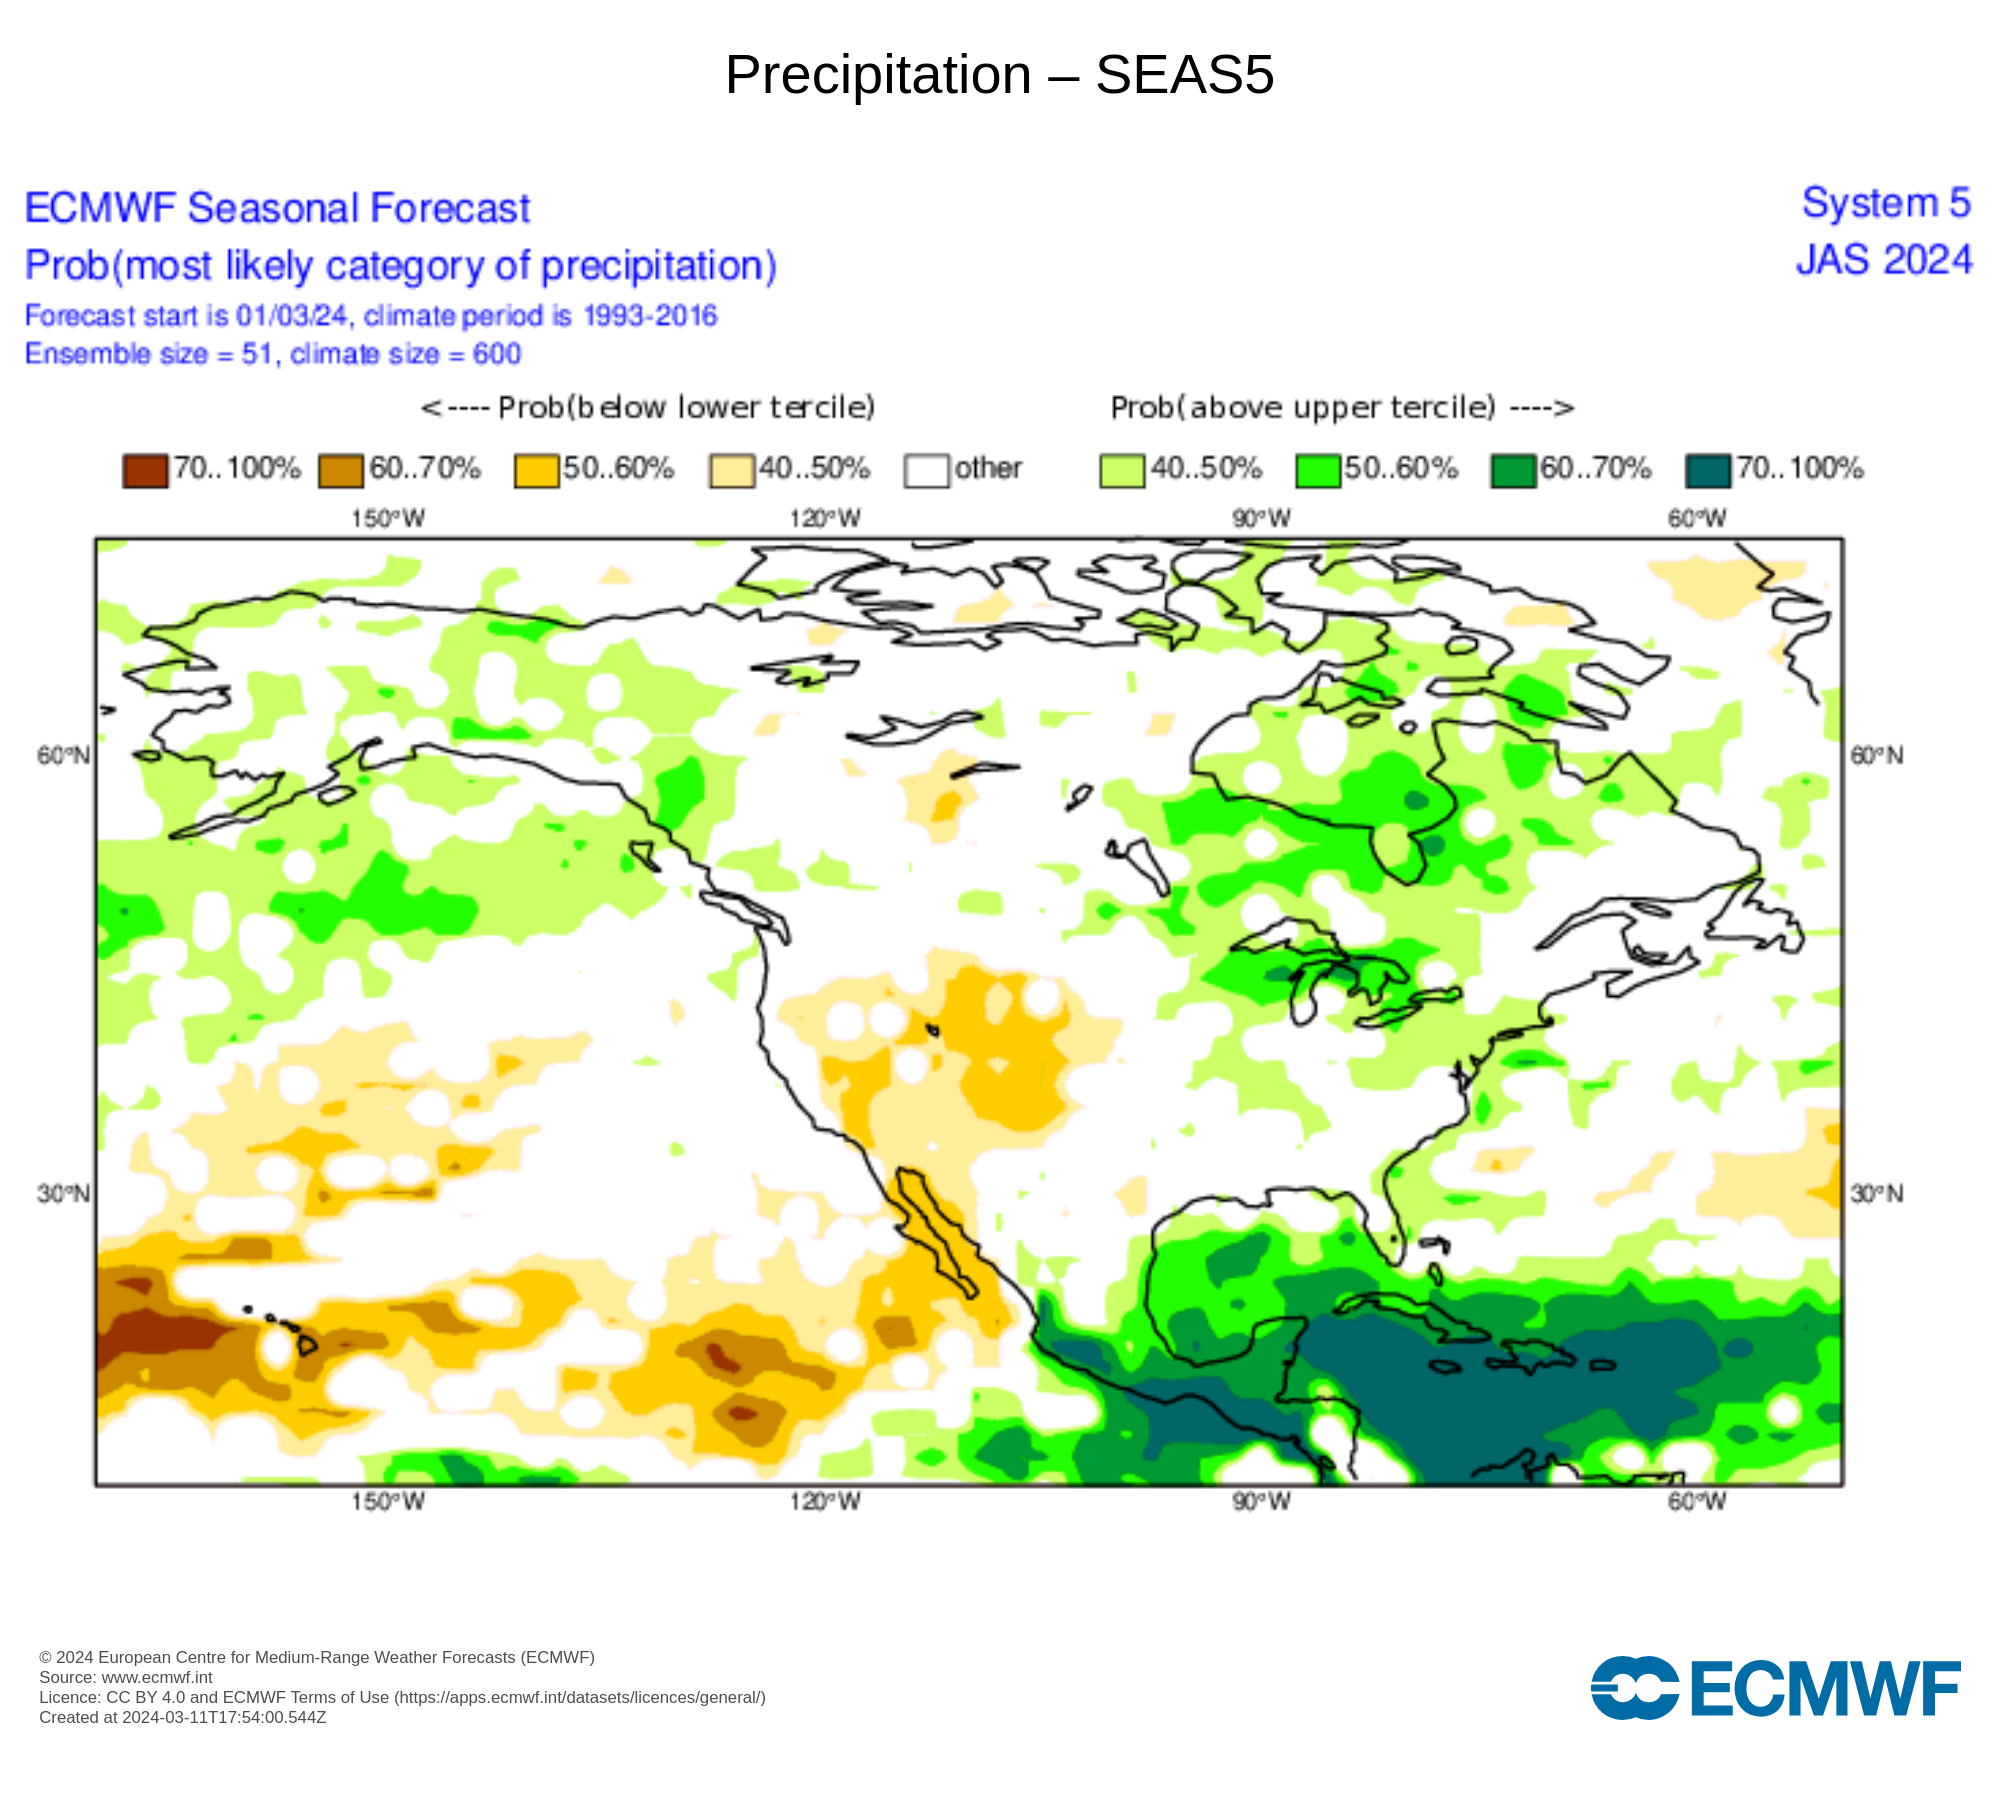
These maps are Seasonal Outlooks from the ECMWF models for June-July-August showing the Probable Temperature and Precipitation Trend. |
  |
Seasonal Weather Anomalies and Probability for Mercer County, Illinois
Model ECMWF CFSv2 IMME METEO ECMWF SEAS5 ECMWF CFSv2 IMME METEO ECMWF SEAS5
Month Temp Temp Temp Temp Temp Prate Prate Prate Prate Precip
Dept Dept Dept Dept Prob Tercile Anom Anom Anom Anom Prob Tercile
March +0.25 +1.00 +0.50 +2.00 +50-60% +0.40 -0.20 +0.20 +0.60 Other
April +0.50 +1.00 +1.00 +0.50 +50-60% +0.30 +0.20 +0.20 +0.40 Other
May +0.50 +0.50 +1.00 +1.00 +60-70% +0.40 +0.20 +0.40 +0.20 +50-60%
June +0.50 +0.50 +1.00 +1.00 +60-70% +0.60 +0.00 +0.00 -0.20 +40-50%
July +1.00 +1.00 +1.00 +1.00 +60-70% +0.00 -0.40 -0.10 -0.40 +50-60%
Just prior to the planting season, there is a good chance of significant rainfall across a large area of Illinois helping to moisten soils in preparation for the spring planting season. The drought conditions in western Illinois (DO) may actually decline. The spring planting season looks favorable across Illinois. Warmer than normal conditions should encourage germination and soil moisture should support early vegetation growth. The ECMWF SEAS5 probability trend does not show a higher or lower probability for precipitation during the month of April. This could be interpreted as a period of time with warm and dry weather allowing a favorable planting window in April, with a higher probability of warm, wet weather in May and or June.
In general, the ECMWF SEAS5 probability trend suggest warmer than normal temperatures in the eastern cornbelt and normal to above normal precipitation. The western cornbelt will trend normal to above normal temperatures with normal to below normal precipitation.
With severe drought already in place over north and eastern Iowa, it is possible that corn and soybeans will be in considerable stress during this upcoming summer. The ECMWF El Nino 3.4 sea surface temperature forecast is cooling toward neutral conditions during the summer months. We see the ECMWF models projecting near to above norml precipitation for spring and near normal precipitation for July. On the other hand, the CFSv2 El Nino 3.4 sea surface temperature forecast is forecast to cool at a more rapid rate toward La Nina conditions during the months of June to August. This model is showing near normal precipitation this spring and drier conditions by July. Both the IMME model and the Meteo models seem to agree with a trend toward near to above normal precipitation in the spring and drier conditions by July into the Fall. Farmers will want to take a look at drought resistant seed and continue to practice conservation designed to preserve soil moisture.
|
|
|